Interest Rates

5 Simple Graphs Proving This is NOT Like Last Time

With all of the volatility in the stock market and uncertainty about the Coronavirus (COVID-19), some are concerned we may be headed for another housing crash like the one we experienced from 2006-2008. The feeling is understandable. Ali Wolf, Director of Economic Research at the real estate consulting firm Meyers Research, addressed this point in a recent interview:

“With people having PTSD from the last time, they’re still afraid of buying at the wrong time.”

There are many reasons, however, indicating this real estate market is nothing like 2008. Here are five visuals to show the dramatic differences.

1. Mortgage standards are nothing like they were back then.

During the housing bubble, it was difficult NOT to get a mortgage. Today, it is tough to qualify. The Mortgage Bankers’ Association releases a Mortgage Credit Availability Index which is “a summary measure which indicates the availability of mortgage credit at a point in time.” The higher the index, the easier it is to get a mortgage. As shown below, during the housing bubble, the index skyrocketed. Currently, the index shows how getting a mortgage is even more difficult than it was before the bubble.

Kate_Spad_Blog_Historic_Data_for_the_Mortgage_Credit_Availability_Index.jpg

2. Prices are not soaring out of control.

Below is a graph showing annual house appreciation over the past six years, compared to the six years leading up to the height of the housing bubble. Though price appreciation has been quite strong recently, it is nowhere near the rise in prices that preceded the crash.

Kate_Spad_Blog_Annual_Home_Price_Appreciation.jpg

There’s a stark difference between these two periods of time. Normal appreciation is 3.6%, so while current appreciation is higher than the historic norm, it’s certainly not accelerating beyond control as it did in the early 2000s.

3. We don’t have a surplus of homes on the market. We have a shortage.

The months’ supply of inventory needed to sustain a normal real estate market is approximately six months. Anything more than that is an overabundance and will causes prices to depreciate. Anything less than that is a shortage and will lead to continued appreciation. As the next graph shows, there were too many homes for sale in 2007, and that caused prices to tumble. Today, there’s a shortage of inventory which is causing an acceleration in home values.

Kate_Spad_Blog_Monthly_Inventory_of_Hpmes_for_Sale.jpg

4. Houses became too expensive to buy.

The affordability formula has three components: the price of the home, the wages earned by the purchaser, and the mortgage rate available at the time. Fourteen years ago, prices were high, wages were low, and mortgage rates were over 6%. Today, prices are still high. Wages, however, have increased and the mortgage rate is about 3.5%. That means the average family pays less of their monthly income toward their mortgage payment than they did back then. Here’s a graph showing that difference:

Kate_Spad_Blog_Percent_of_Median_Income_Needed_to_Purchase_a_Median_Priced_Home.jpg

5. People are equity rich, not tapped out.

In the run-up to the housing bubble, homeowners were using their homes as a personal ATM machine. Many immediately withdrew their equity once it built up, and they learned their lesson in the process. Prices have risen nicely over the last few years, leading to over fifty percent of homes in the country having greater than 50% equity. But owners have not been tapping into it like the last time. Here is a table comparing the equity withdrawal over the last three years compared to 2005, 2006, and 2007. Homeowners have cashed out over $500 billion dollars less than before:

Kate_Spad_Blog_Total_Home_Equity_Cashed_Out.jpg

During the crash, home values began to fall, and sellers found themselves in a negative equity situation (where the amount of the mortgage they owned was greater than the value of their home). Some decided to walk away from their homes, and that led to a rash of distressed property listings (foreclosures and short sales), which sold at huge discounts, thus lowering the value of other homes in the area. That can’t happen today.

Bottom Line

If you’re concerned we’re making the same mistakes that led to the housing crash, take a look at the charts and graphs above to help alleviate your fears.

Opportunity in the Luxury Market This Year

Homes priced in the top 25% of a price range for a particular area of the country are considered “premium homes.” At the start of last year, many of the more expensive homes listed for sale hadn’t seen as much interest, since much of the demand for housing over the past few years has come from first-time buyers looking for starter homes. It looks like buyer activity, however, is starting to show a shift in this segment.

According to the January Luxury Report from the Institute for Luxury Home Marketing (ILHM):

“In a snapshot of 2019, despite pessimism at the start of the year, the last quarter showcased a strengthening, with an upswing in the luxury market for sales in both the single family and condo markets.”

Momentum is growing, and those looking to enter the luxury market are poised for success in 2020 as well. With more inventory available at the upper-end, historically low interest rates, and increasing average wages, the stage is set for buyers with an interest in this tier to embrace the perfect move-up opportunity.

The report highlights the increase in buyer activity in this segment, resulting in growing sales toward the end of 2019:

“According to reports from many luxury real estate professionals, the significant increase in number of properties bought at the end of 2019 versus 2018 is reflective of an early 2019 holding pattern.

Many of early 2019’s prospective luxury buyers held off while waiting to see how prices would react to new tax regulations and other policy changes. Buyer confidence returned in late spring and compared to 2018, above average sales were reported in the final quarter of 2019.”

With evidence of strong buyer confidence, this is great news, as more homeowners are building equity and growing their net worth throughout the country:

“Many homeowners are now diversifying their wealth, owning several properties rather than a single mega mansion. In addition, there have been an increase number of home purchases taking place in smaller cities, reflecting the rising number of people relocating from major metropolises. Their property equity wealth or ability to pay high rental costs have afforded them the opportunity to purchase luxury properties in…secondary cities throughout North America.”

With a strong economy and a backdrop set for moving up this year, it’s a great time to explore the luxury market. Keep in mind, luxury can mean different things to different people, too. To one person, luxury is a secluded home with plenty of property and privacy. To another, it is a penthouse at the center of a bustling city. Knowing what characteristics mean luxury to you will help your agent understand what you’re after as you define the scope and location for the home of your dreams.

Bottom Line

If you’re thinking about upgrading your current house to a luxury home, or adding an additional property to your portfolio, reach out to a local real estate professional to determine if you’re ready to make your move.

A Look at Home Sales Across the Country by Region

Existing-home sales have been fluctuating in recent months, but one clear trend is emerging: First-time home buyers are making a move into the housing market as low mortgage rates prove to be an enticing incentive.

Lawrence Yun, chief economist for the National Association of REALTORS®, says he’s encouraged by the upturn in first-time home buyers in NAR’s latest existing-home sales report. First-timers comprised 32% of sales last month, up from 29% a year ago, according to NAR. “It’s good to see first-time buyers slowly stepping into the market,” Yun says. “The rise in the homeownership rate among younger adults under 35 and minority households means an increasing number of Americans can build wealth by owning real estate. Still, in order to further expand opportunities, significantly more inventory and home construction are needed at the affordable price points.”

The national homeownership rate has been rising strongly among people younger than 35, increasing from 35.4% in early 2019 to 37.6% in late 2019, Yun adds. Across age groups, existing-home sales are off to a “strong start” at 5.46 million for 2020, Yun says. “The trend line for housing starts is increasing and showing steady improvement, which should ultimately lead to more home sales.”

However, overall sales in January dipped month over month due mostly to the Western region of the country. Overall, existing-home sales—which include completed transactions for single-family homes, townhomes, condos, and co-ops—fell 1.3% compared to December. Still, home sales are up annually for the second consecutive month, with the latest numbers showing a 9.6% gain year over year in January, NAR’s housing report shows.

Here’s a closer look at key indicators from NAR’s latest housing report:

  • Home prices: The median existing-home price for all housing types in January was $266,300, up 6.8% from a year ago. Prices rose in every region last month. “Mortgage rates have helped with affordability, but it is supply conditions that are driving price growth,” Yun says.

  • Inventories: The total housing inventory at the end of January was 1.42 million units, down 10.7% from a year ago. Housing inventories are at the lowest levels for January since 1999. Unsold inventory is at a 3.1-month supply at the current sales pace.

  • Days on the market: Forty-two percent of homes sold in January were on the market for less than a month. Properties stayed on the market for a median of 43 days in January, down from 49 days a year ago.

  • All-cash sales: All-cash sales accounted for 21% of transactions in January, down from 23% a year ago. Individual investors and second-home buyers account for the largest bulk of cash sales. They purchased 17% of homes in January, up slightly from 16% a year ago.

  • Distressed sales: Foreclosures and short sales comprised just 2% of sales in January, down from a year ago.

Regional Sales Snapshot

  • Midwest: sales rose 2.4% in the region, reaching an annual rate of 1.29 million, up 8.4% from a year ago. Median price: $200,000, up 5.4% from January 2019

  • South: sales increased 0.4% to an annual rate of 2.38 million in January, up 11.7% from a year ago. Median price: $229,000—a 6.3% increase from a year ago

  • West: sales decreased 9.4% in January to an annual rate of 10.6 million, still an 8.2% increase compared to a year ago. Median price: $393,800, up 5.2% from a year ago

  • Northeast: sales saw no major movement in January compared to December, remaining at an annual rate of 730,000. That is up, however, 7.4% from a year ago. Median price: $312,100—up 11.5% from a year ago

Source:  National Association of REALTORS®

The #1 Misconception in the Homebuying Process

After over a year of moderating home prices, it appears home value appreciation is about to reaccelerate. Skylar Olsen, Director of Economic Research at Zillow, explained in a recent article:

 “A year ago, a combination of a government shutdown, stock market slump and mortgage rate spike caused a long-anticipated inventory rise. That supposed boom turned out to be a short-lived mirage as buyers came back into the market and more than erased the inventory gains. As a natural reaction, the recent slowdown in home values looks like it’s set to reverse back.”

CoreLogic, in their January 2020 Market Pulse Report, agrees with Olsen, projecting home value appreciation in all fifty states this year. Here’s the breakdown:

  • 21 states appreciating 5% or more

  • 26 states appreciating between 3-5%

  • Only 3 states appreciating less than 3%

The Misconception

Many believe when real estate values are increasing, owning a home becomes less affordable. That misconception is not necessarily true.

In most cases, homes are purchased with a mortgage. The current mortgage rate is a major component of the affordability equation. Mortgage rates have fallen by almost a full percentage point since this time last year.

Another major piece of the equation is a buyer’s income. The median family income has risen by 5% over the last year, contributing to the affordability factor.

Black Knight, in their latest Mortgage Monitor, addressed this exact issue:

 “Despite the average home price increasing by nearly $13,000 from just over a year ago, the monthly mortgage payment required to buy that same home has actually dropped by 10% over that same span due to falling interest rates…

Put another way, prospective homebuyers can now purchase a $48K more expensive home than a year ago while still paying the same in principal and interest, a 16% increase in buying power.”

Bottom Line

If you’re thinking about purchasing a home, realize that homes are still affordable even though prices are increasing. As the Black Knight report concluded:

“Even with home price growth accelerating, today’s low-interest-rate environment has made home affordability the best it’s been since early 2018.”

The 4 Crucial Real Estate Questions

This is going to be an exciting year for real estate. The upcoming presidential election, a possible recession, and political tensions are all factors leading to confusion and hesitancy.

Will the Presidential Election Impact Real Estate?

Election years can be a tricky time for the market. During this time, both sides of the spectrum will be preaching conflicting statements about the economy – leading to confusion among potential buyers and sellers.

That’s why many people tend to sit back and wait until the election is over before making any major real estate decisions. This isn’t a new phenomenon, but with the market’s current strength and mortgage rates at historic lows, putting off buying or selling could mean less of a reward as more time goes on.

Is a Recession Around the Corner?

When a media storm of recession talk hit the news in 2019, many people affiliated it with another housing market collapse. The fears aren’t surprising, but they’re also not accurate.

Economists are now reporting that if a recession occurs, it may not be until 2021 or even 2022. On top of that, the real estate market is not a likely driving factor for an economic downturn, and the four recessions before 2008 saw little to no effect on the housing market.

What If I Buy a Home and Prices Depreciate?

It’s the greatest fear a new homeowner has. Many prospective buyers may be holding off on their search because of uncertainty tied to the upcoming presidential election and recession rumors.

The market is strong and big hitters like Freddie Mac, Fannie Mae and NAR predict home values to continue to appreciate through 2021.

Buying now is a sound investment, and buyers should take advantage of the current low mortgage rates because waiting to purchase a home could mean paying more.

Kate_Spad_Blog_Home_Prices_Projected_To_Continue_To_Appreciate.png

Should I Take Advantage of Interest Rates Now or Wait?

Essentially this comes down to one thing: why take the chance?

Interest rates are currently at historic lows, and you are probably unaware of their increased buying power. Although the mortgage rates are projected to hold steady around 3.8%, certain factors could change this.

If you hold off on your home search and mortgage rates do rise, you will end up paying more for the same house.

There are major benefits to buying your dream home this year.


Mortgage Rates Digging Deeper Into Multi-Year Lows

BY: MATTHEW GRAHAM

Feb 3 2020, 5:39PM

In the world of interest rates, it's good to be a mortgage today.  The dominant species on that world is US Treasuries: the quintessential dollar-based loans (after all, they are loans to the US government).  Loaning dollars to the entity responsible for the dollar is about as foundational as it gets, but I digress.

Treasuries and mortgage rates tend to move in the same direction and by generally similar amounts. That's because mortgage rates are based on underlying bonds (mortgage-backed securities or "MBS") that are fairly similar to Treasuries in most of the ways investors care about.  The prices of MBS dictate where lenders can and should set their interest rates, but ultimately, it's up to the lender.  If they're flush with business and want to slow things down, they might set rates a bit higher.  The same thing can happen heading into a weekend during times of elevated volatility.

Such was the case on Friday.  Lenders had a nice improvement in MBS to work with.  It allowed them to lower rates a bit more than they actually did.  Now, as the new week begins, Treasury yields and MBS alike are indicating slightly higher rates than Friday, but because lenders played it so safe, they were instead able to offer slightly LOWER rates today.  Simply put, mortgage rates are even deeper into multi-year lows now, even though the bond market is pointing to slightly higher rates versus last Friday. 


Loan Originator Perspective

Bond yields hit a bit of a wall Monday, moving upward from Friday's multi-year lows, amid upbeat economic data and potential progress on a Wuhan virus treatment.  We may not be at the very lowest yields here, but it'd take monumentally horrible news to move rates much lower.  I am locking loans closing within 45 days for all but the most risk craving clients.  - Ted Rood, Senior Originator


Today's Most Prevalent Rates For Top Tier Scenarios 

  • 30YR FIXED - 3.375-3.5%

  • FHA/VA - 3.125 - 3.25%

  • 15 YEAR FIXED - 3.125-3.25% 

  • 5 YEAR ARMS -  3.25-3.75% depending on the lender


Ongoing Lock/Float Considerations 

  • 2019 was the best year for mortgage rates since 2011.  Big, long-lasting improvements such as this one are increasingly susceptible to bounces/corrections 

  • Fed policy and the US/China trade war have been key players (and more recently, the coronavirus outbreak).  Major updates on either front could cause a volatile reaction in rates.  

  • The Fed and the bond market (which dictates rates) will be watching economic data closely, both at home and abroad, as well as updates on other factors like trade and viral epidemics. The stronger the data the more rates could rise, while weaker data will lead to new long-term lows.  

  • Rates discussed refer to the most frequently-quoted, conforming, conventional 30yr fixed rate for top tier borrowers among average to well-priced lenders.  The rates generally assume little-to-no origination or discount except as noted when applicable.  Rates appearing on this page are "effective rates" that take day-to-day changes in upfront costs into consideration.

How Buyers Can Win By Downsizing in 2020

Home values have been increasing for 93 consecutive months, according to the National Association of Realtors. If you’re a homeowner, particularly one looking to downsize your living space, that’s great news, as you’ve likely built significant equity in your home.

Here’s some more good news: mortgage rates are expected to remain low throughout 2020 at an average of 3.8% for a 30-year fixed-rate loan.

The combination of leveraging your growing equity and capitalizing on low rates could make a big difference in your housing plans this year.

How to Use Your Home Equity

For move-up buyers, the typical pattern for building financial stability and wealth through homeownership works this way: you buy a house and gain equity over several years of mortgage payments and price appreciation. You then take that equity from the sale of your house to make a down payment on your next home and repeat the process.

For homeowners ready to downsize, home equity can work in a slightly different way. What you choose to do depends in part upon your goals.

According to HousingWire.com, for some, the desire to downsize may be related to retirement plans or children aging out of the home. Others may be choosing to live in a smaller home to save money or simplify their lifestyle in a space that’s easier to clean and declutter. The reasons can vary greatly and by generation.

Those who choose to put their equity toward a new home have the opportunity to make a substantial down payment or maybe even to buy their next home in cash. This is incredibly valuable if your goal is to have a minimal mortgage payment or none at all.

A local real estate professional can help you evaluate your equity and how to use it wisely. If you’re planning to downsize, keep in mind that home prices are anticipated to continue rising in 2020, which could influence your choices.

The Impact of Low Mortgage Rates

Low mortgage rates can offset price hikes, so locking in while rates are low will be key. For many downsizing homeowners, a loan with a shorter term is ideal, so the balance can be reduced more quickly.

Interest rates on 10, 15, and 20-year loans are lower than the rates on a 30-year fixed-rate loan. If you’re downsizing your housing costs, you may prefer a shorter-term loan to pay off your home faster. This way, you can save thousands in interest payments over time.

Bottom Line

If you’re planning a transition into a smaller home, the twin trends of low mortgage rates and rising home equity can kickstart or boost your plans, especially if you’re anticipating retirement soon or just want to live in a smaller home that’s easier to maintain. Consult a local real estate professional today to explore your options.

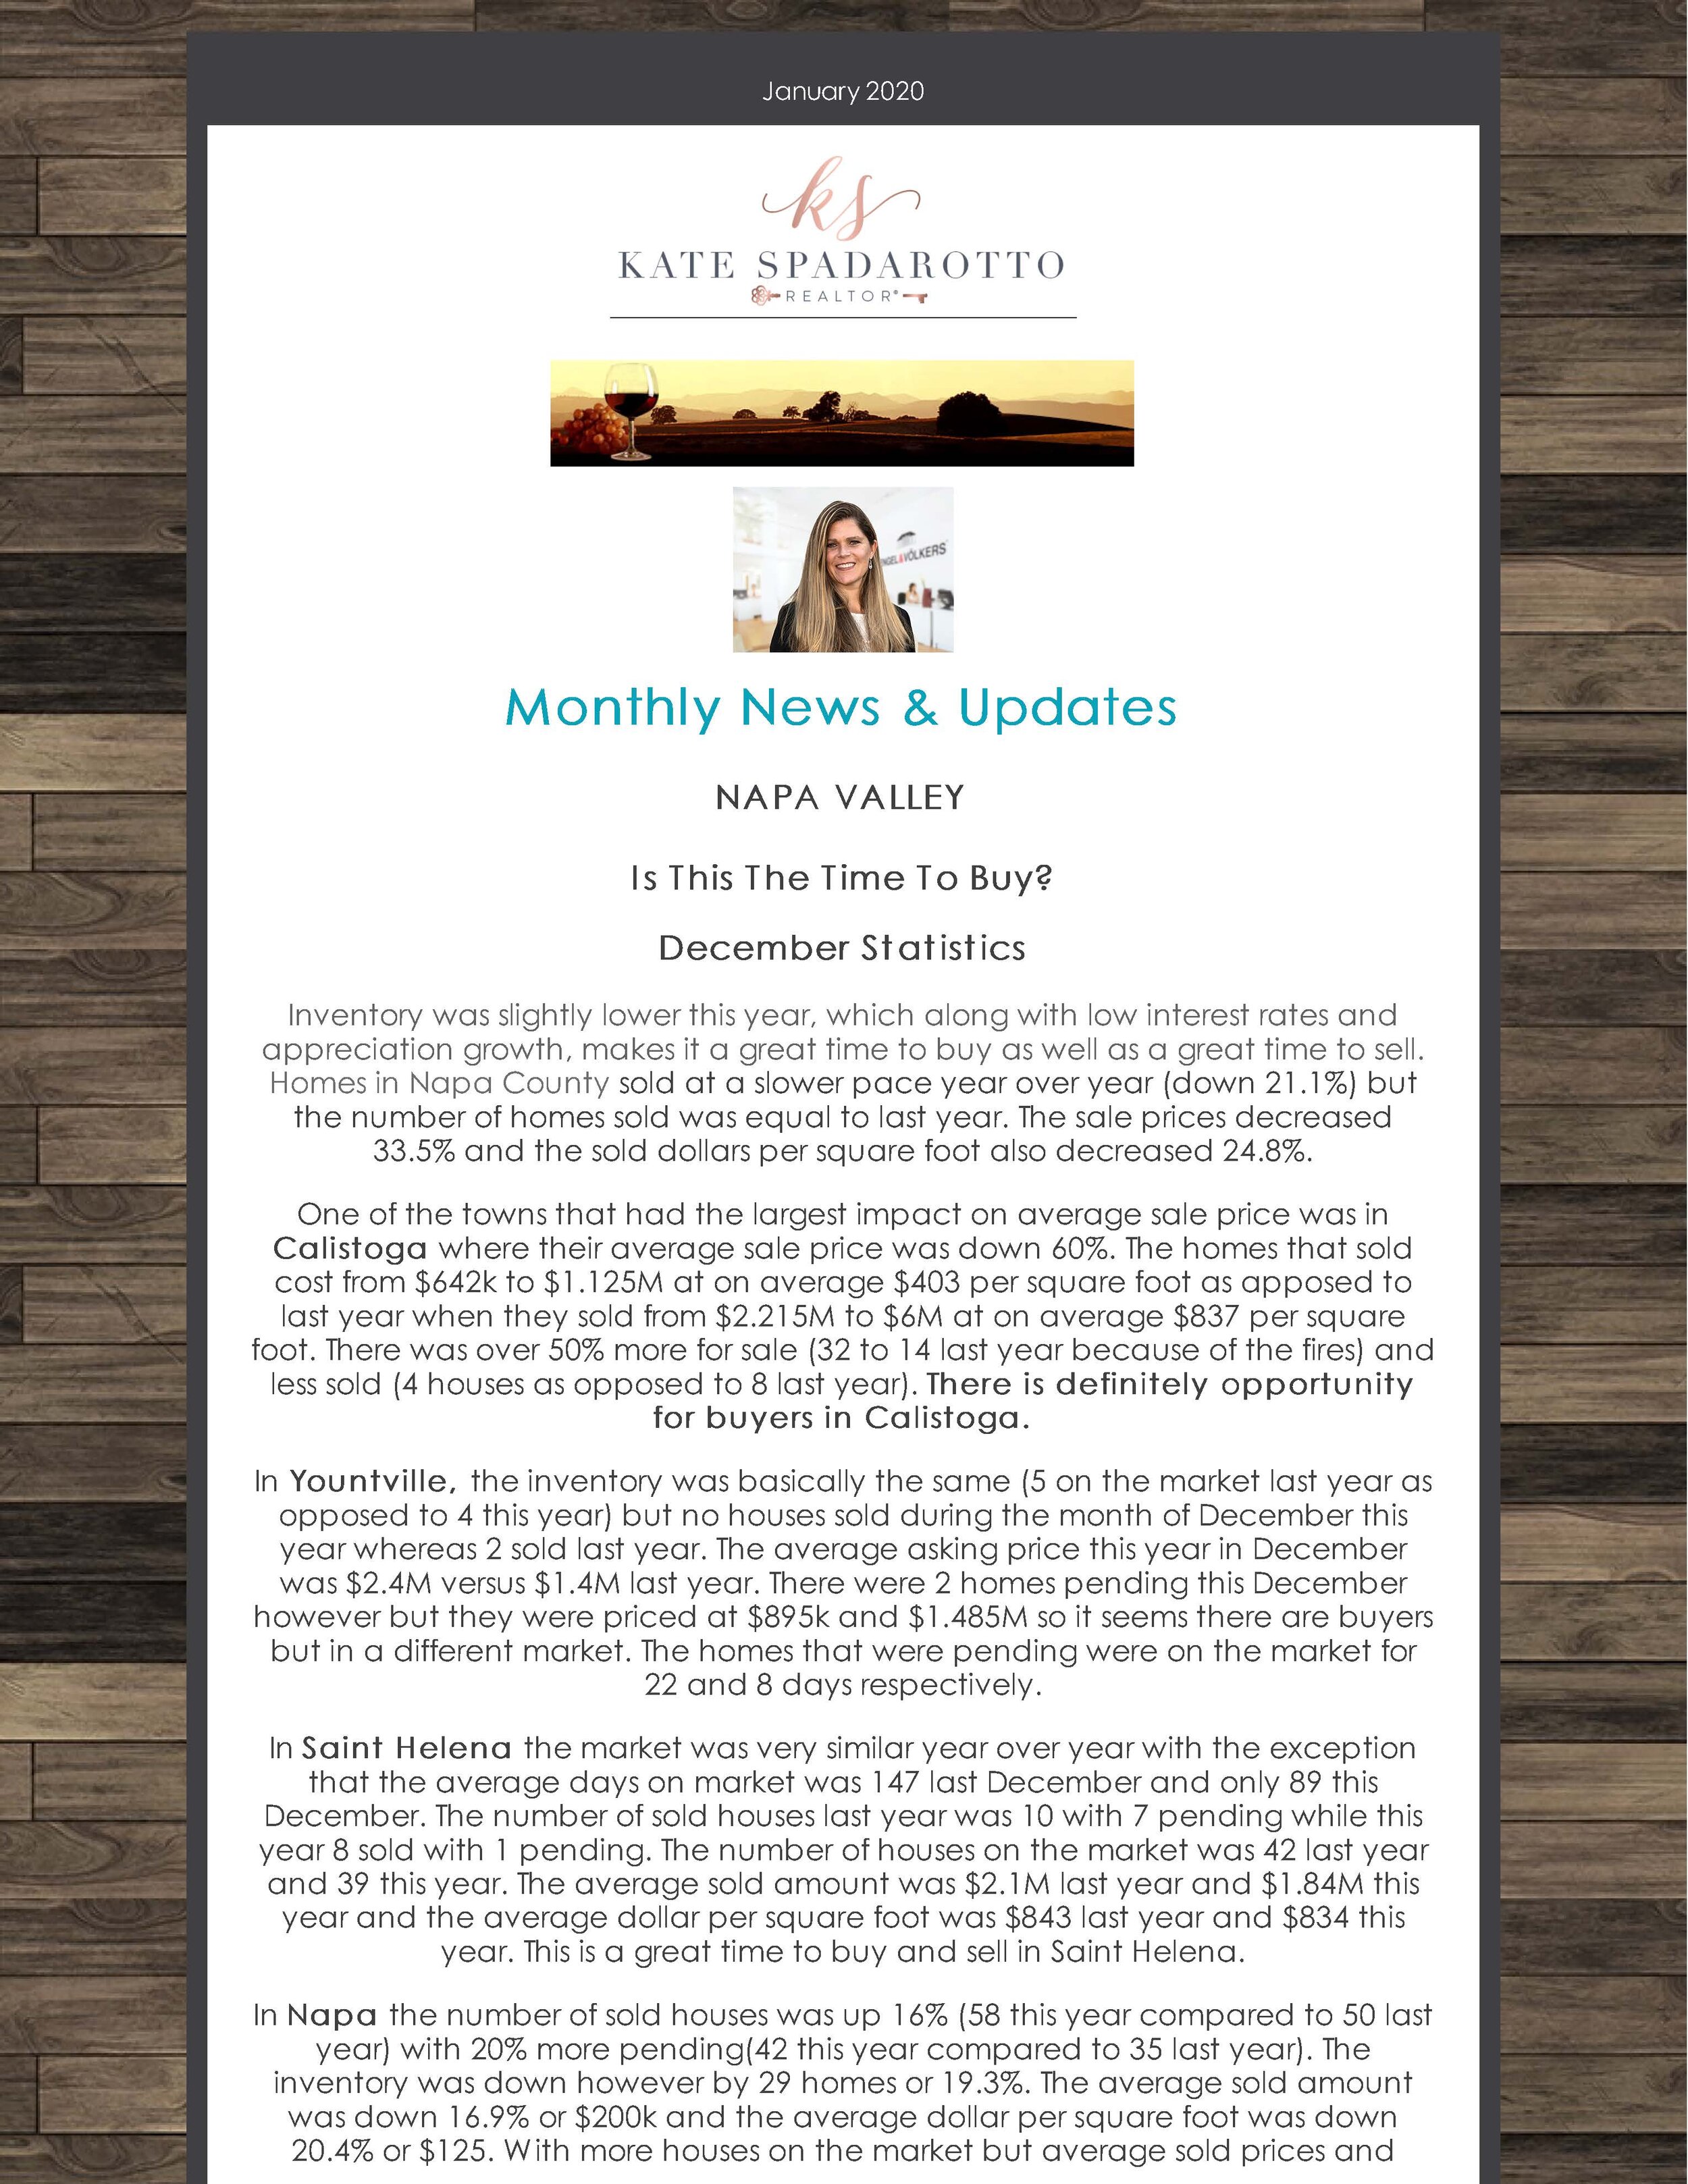
January 2020 Real Estate News Update

Kate_Spad_Blog_January_2020_Real_Estate_News _Updates_Page_1.jpg
Kate_Spad_Blog_January_2020_Real_Estate_News _Updates_Page_2.jpg
Kate_Spad_Blog_January_2020_Real_Estate_News _Updates_Page_3.jpg

The 2020 Real Estate Projections That May Surprise You

This will be an interesting year for residential real estate. With a presidential election taking place this fall and talk of a possible recession occurring before the end of the year, predicting what will happen in the 2020 U.S. housing market can be challenging. As a result, taking a look at the combined projections from the most trusted entities in the industry when it comes to mortgage rateshome sales, and home prices is incredibly valuable – and they may surprise you.

Mortgage Rates

Projections from the experts at the National Association of Realtors (NAR), the Mortgage Bankers Association (MBA), Fannie Mae, and Freddie Mac all forecast mortgage rates remaining stable throughout 2020:

Kate_Spad_Blog_30_Yr_Mortgage_Rate_Projected_To_Remain_Stable.jpg

Since rates have remained under 5% for the last decade, we may not fully realize the opportunity we have right now.

Here are the average mortgage interest rates over the last several decades:

  • 1970s: 8.86%

  • 1980s: 12.70%

  • 1990s: 8.12%

  • 2000s: 6.29%

Home Sales

Three of the four expert groups noted above also predict an increase in home sales in 2020, and the fourth sees the transaction number remaining stable:

Kate_Spad_Blog_Home_Sales_Projected_To_Grow_2020.jpg

With mortgage rates remaining near all-time lows, demand should not be a challenge. The lack of available inventory, however, may moderate the increase in sales.

Home Prices

Below are the projections from six different expert entities that look closely at home values: CoreLogicFannie Mae, Ivy Zelman’s “Z Report”, the National Association of Realtors (NAR), Freddie Mac, and the Mortgage Bankers Association (MBA).Each group has home values continuing to improve through 2020, with four of them seeing price appreciation increasing at a greater pace than it did in 2019.

Kate_Spad_Blog_Home_Values_Expected_to_Continue_Appreciating.jpg

Is a Recession Possible?


In early 2019, a large percentage of economists began predicting a recession may occur in 2020. In addition, a recent survey of potential home purchasers showed that over 50% agreed it would occur this year. The economy, however, remained strong in the fourth quarter, and that has caused many to rethink the possibility.

For example, Goldman Sachs, in their 2020 U.S. Outlook, explained:

“Markets sounded the recession alarm this year, and the average forecaster now sees a 33% chance of recession over the next year. In contrast, our new recession model suggests just a 20% probability. Despite the record age of the expansion, the usual late-cycle problems—inflationary overheating and financial imbalances—do not look threatening.”

Bottom Line

Mortgage rates are projected to remain under 4%, causing sales to increase in 2020. With growing demand and a limited supply of inventory, prices will continue to appreciate, while the threat of an impending recession seems to be softening. It looks like 2020 may be a solid year for the real estate market.

December 2019 Real Estate News & Updates

Please let me know if you would like to receive my monthly newsletter by messaging me your email address. I promise this will be the only thing I will email you and I will not share your email address.

Thank you,

Kate Spadarotto

December 2019 Real Estate News Updates_Page_1.jpg
December 2019 Real Estate News Updates_Page_2.jpg

The Current 5 Most Popular Real Estate Questions and Answers

  1. Are Mortgage Rates Going to Go Up?

With the price of homes going up due to a strong economy and high demand, mortgage rates are helping to balance it all out by keeping things affordable.

Essentially, the lower your mortgage rate, the lower your monthly payments.

With Freddie Mac predicting that mortgage rates should stay where they are for the next 12 months, this shouldn’t be changing anytime soon.

Kate_Spad_Blog_Mortgage_Rates_Freddie_Mac.jpg

2. Is Now a Good Time to Buy or Sell?

The short answer is: yes and yes.

As said above, low mortgage rates mean it’s a great time for anyone to buy: whether it’s for the first, second or fifth time. This is especially true for someone looking to upgrade their home and purchase one in a higher bracket.

The low mortgage rate will help you afford more house at a lower monthly payment.

Combine that with low inventory and high demand, and you have an equally good seller’s market. This goes especially for homes in the low to mid-range.

Kate_Spad_Blog_Housing_Affordability_Index.jpg

3. Are Home Prices Going to Keep Rising?

Data from the leading experts in real estate and mortgage lending says yes.

But before anyone panics, that means now is the best time to buy and sell.

With mortgage rates expecting to stay where they are and an anticipated 3.5-5% price appreciation happening in the next year, this is without a doubt the best time to buy.

Waiting only means one thing: spending more for the same house.

Take a look at our price appreciation slide so you can show them the facts to back it up.

Kate_Spad_Blog_Projected_Appreciation_Going_Forward.jpg

4. Do I Need to Update My Home Before I Sell It?

Making updates could mean a higher asking price. It could also mean investment loss.

Depending on the type of updates needed, the market’s current low inventory levels put any home that hits the market in a good position to sell. Yes, some homeowners prefer to buy a “turn-key” home. On the flip side, others may want to make the updates themselves, so everything is to their taste.

Check out this post on which updates have the highest return on investment.

5. Is a Recession Going to Cause Home Prices to Fall?

Yes, it’s very likely a recession will hit either next year or the year after. However, this in no way means a housing market catastrophe like the one that occurred in 2008.

Here’s why:

-Of the last five recessions, only two saw a decline in home values with three seeing increases.
-The two that saw declines were in 1991 (-1.9%) and of course, 2008 (-19.7%).
-The current market does not remotely resemble the one before the 2008 crash.
-The top causes for the next recession have nothing to do with the housing market, unlike that of 2008 when risky borrowing led to a bubble that was bound to burst.


2018's Home Sales Slump Now Fully Erased

BY: JANN SWANSON

While the increase wasn't as strong as in July, last month's existing home sales posted a second straight month of gains and, as previously, the National Association of Realtors® (NAR) credited falling interest rates.  Sales of previously owned single-family houses, townhouses, condominiums, and cooperative apartments were up 1.3 percent compared to July when sales rose 2.5 percent.  The seasonally adjusted annual rate of 5.49 million units was 2.6 percent higher than the August 2018 pace of 5.35 million. The increase was felt in three of the four major regions while the West continues to demonstrate some weakness.

The month's results were better than predicted.  Analysts polled by Econoday had expected them to come in at an annual rate of 5.30 to 5.42 million with a consensus of 5.38 million.

Single-family home sales rose from 4.84 million in July to 4.90 million in August, a 1.2 percent gain and 2.9 percent above the August 2018 rate. Existing condo sales rose 1.7 percent from July to 590,000 annual units, largely unchanged from the previous August.

Lawrence Yun, NAR's chief economist, said, "As expected, buyers are finding it hard to resist the current rates. The desire to take advantage of these promising conditions is leading more buyers to the market."

The median existing home price for all housing types in August was $278,200, up 4.7 percent from the median a year earlier of $265,600.  It was the 90th straight month of year-over-year gains. The median existing single-family home price also rose 4.7 percent to $280,700.  Condo prices were up 5.2 percent to a median of $257,600 in August.

"Sales are up, but inventory numbers remain low and are thereby pushing up home prices," said Yun. "Homebuilders need to ramp up new housing, as the failure to increase construction will put home prices in danger of increasing at a faster pace than income."

Inventory fell in August, down from 1.90 million available homes to 1.86 million and 2.6 percent fewer homes than a year earlier. Unsold inventory is at a 4.1-month supply at the current sales pace, down from 4.2 months in July and from the 4.3-month figure recorded in August 2018. Properties typically remained on the market for 31 days in August, up from 29 days in both July and the prior August. Forty-nine percent of homes sold in August were on the market for less than a month.

Yun criticized the quarter point cut in the Fed Funds rate made by the Federal Reserve on Wednesday.  "[The Fed] should have been bolder and made a deeper rate cut, given current low inflation rates," he said. "The housing sector has been broadly underperforming but there is huge upward potential there that will help our overall economy grow."

First-time buyers were responsible for 31 percent of sales in August, the same as a year and investors and second home buyers accounted for 14 percent, up from 11 percent in July.  All-cash sales accounted for 19 percent of transactions in August, about equal to July and moderately below August 2018. Distressed sales remained negligible, representing 2 percent of August sales, a 1-point decline from a year earlier.

 "Rates continue to be historically low, which is extremely beneficial for everyone buying or selling a home," said NAR President John Smaby. "The new [FHA] condominium loan policies, as well as other reforms NAR is pursuing within our housing finance system, will allow even more families and individuals in this country to reach the American Dream of homeownership."

There were month-over-month increases in existing home sales in the Northeast, Midwest, and South and sales in all four regions bested their 2018 numbers. Sales in the Northeast increased 7.6 percent from July to an annual rate of 710,000 units, 1.4 percent higher than in August 2018. The median price fell 0.3 percent on an annual basis to $303,500.

Existing-home sales grew 3.1 percent in the Midwest to an annual rate of 1.31 million, topping sales from a year earlier by 2.3 percent.  The median price jumped 6.6 percent to $220,000.

In the South there was a gain of 0.9 percent in sales to a rate of 2.33 million and sales were 3.6 percent higher year-over-year. The median price of $240,300 was a 5.4 percent annual increase.

While sales remained 1.8 percent higher on an annual basis, the West was an outlier in August. Existing home sales declined 3.4 percent to 1.14 million. Prices, however, continued their strong appreciation, rising 5.7 percent to $415,900.

The Fed and Mortgage Rates

One of the greatest potential sources of confusion for prospective mortgage borrowers is the relationship between the Fed and mortgage rates.  While the Fed's policy changes absolutely have a big impact on all sorts of interest rates (including mortgages), a drop in the Fed's policy rate DOES NOT result in lower mortgage rates. 

The main reason for confusion is the fact that there's a huge difference from an investment standpoint between a rate that governs the shortest-term transactions (The Fed Funds Rate applies to loans that last for 1 day or less) and a rate that can remain in effect for up to 30 years in the case of mortgages.  Even if we use the average life span of a 30yr fixed mortgage, we're still talking about 5-10 years depending on the broader market landscape. You may have heard about the "inverted yield curve?"  That's a reference to vastly different behavior between longer and shorter term rates, and it stands as evidence of the different sets of concerns that apply to each side of the duration spectrum.  The differences are only more pronounced when we take the shorter end of the spectrum all the way down to the "overnight" level (Fed Funds Rate) and all the way up to the duration of the average mortgage loan.

Beyond the fact that a mortgage rate is very simply a different animal than the Fed Funds Rate, there's also the matter of frequency of movement.  The Fed only meets to potentially change rates 8 times a year.  Mortgage rates change every day--sometimes more than once.  And the bond markets that underlie mortgage rates change thousands of times per day.  That means the mortgage market can easily and quickly get into position for any expected move from the Fed.  In today's case, where the rate cut was seen as highly likely, any effect that the Fed Funds Rate could ever have on mortgage rates was already priced-in weeks ago.

But let's say the first two points don't quite convince you.  The third is irrefutable.  The Fed doesn't just take the stage, cut rates, and go home.  They release a ton of other info and hold a press conference to discuss their present and future policy decisions.  The rates market (for mortgages, Treasuries, and everything else) is tremendously interested in all that "other stuff."  Today, particularly, there was a set of updated forecasts for future rate movements.  These were a bit less market-friendly than the average investor expected.  In addition, market participants interpreted Powell's press conference as being a bit less friendly than expected.

Long story short: there are multiple reasons for mortgage rates to go their own way regardless of the Fed rate cut. 

BY: MATTHEW GRAHAM

6 Graphs Showing the Strength of the Current Housing Market

Kate_Spadarotto_Blog_Sept_13_2019.jpg

Some Highlights:

  • Keeping an eye on the current status of the housing market is one of the best ways to make powerful and confident decisions when buying or selling a home.

  • Mortgage rates remaining near historic lows and houses selling in an average of only 29 days are just two key elements driving the strength of today’s market.

  • With the national data shown here, make sure to also determine what’s happening in your local market so you are fully informed when you’re ready to make your next move.

Americans Have Never Felt This Good About Real Estate

Fannie Mae’s Home Purchase Sentiment Index surged to a new high as consumers became more upbeat about buying and selling, mortgage rates, and their jobs. Five of the six components measured by the index rose month over month.

“Consumer job confidence and favorable mortgage rate expectations lifted the HPSI to a new survey high in July, despite ongoing housing supply and affordability challenges,” says Doug Duncan, Fannie Mae’s senior vice president and chief economist. “Consumers appear to have shaken off a winter slump in sentiment amid strong income gains. Therefore, sentiment is positioned to take advantage of any supply that comes to market, particularly in the affordable category. However, recent financial market events following when the survey data were collected could weigh on consumer views looking ahead.”

Overall, the HPSI, based on a survey of 1,000 Americans, rose 7.2 points compared to a year ago to a record-high reading of 93.7 in July. Here are some highlights from the index’s latest readings:

  • Buying: The net share of Americans who said now is a good time to buy a home rose 3 percentage points from June to 26%, up 2 percentage points from a year ago.

  • Selling: The net share of consumers who say it’s a good time to sell rose 1 percentage point to 44%, up 3 percentage points from a year ago.

  • Home prices: The share of Americans who say home prices will go up over the next 12 months fell 1 percentage point to 37%, down 2 percentage points from a year ago.

  • Mortgage rates: The share of consumers who believe mortgage rates will drop over the next year rose 1 percentage point and is up 24 percentage points from a year ago.

  • Job stability: Americans are more confident about their job situation, with the share who say they’re not concerned about losing their job over the next year rising 8 percentage points to 81%. This is up 16 percentage points from a year ago.

  • Household incomes: The share of Americans who say their household income is significantly higher than 12 months ago rose by 1 percentage point to 21%, essentially unchanged from a year ago.

Source: “Home Purchase Sentiment Index,” Fannie Mae (Aug. 7, 2019)

Bottom Line

Consumers are feeling good about the real estate market. Since Americans are not worried about their jobs, see mortgage rates near an all-time low, and believe it is a good time to buy, the housing market will remain strong for the rest of the year.

Appreciation is Strong: It Might Be Time To Sell

There’s no doubt that today’s housing market is changing, and everything we see right now indicates it is time to sell. Here’s a look at why selling now is likely to drive the greatest return on your largest investment.

Home values have been appreciating for several years now, growing at a strong, steady, and impressive pace. In fact, the average annual appreciation rate since 2012 has nearly doubled the average rate from the more normal market of the 1990s (think: pre-bubble).

Average Annual Percentage Appreciation.png

Appreciation, however, is projected to shift back toward normal, meaning home prices will likely keep climbing over the next few years, but they are not projected to continue to increase at such a high rate.

Here’s What That Means for Homeowners:

As noted in the latest Home Price Expectation Survey (HPES) powered by Pulsenomics, experts forecast an average annual appreciation rate closer to 3.2% over the next five years, which is more in line with a historically normal market (3.6%). The good news is, there’s still time to take advantage of the current strength of home prices by selling your house now.

Mean Percentage Appreciation.png

Looking at the projections as they stand today, 2019 is slated to drive the strongest appreciation as compared to the upcoming few years. With average home prices still on the rise, the pace at which they are predicted to continue increasing will likely soften by 2020.

Bottom Line

If you’re thinking about selling your house, now is a great time to make your move. Don’t get stuck waiting until projected home price appreciation rates potentially re-accelerate again in 2023. You’ll likely earn the greatest return on your investment by selling now before the prices start to normalize next year.

Rising Affordability in Purchasing Real Estate

BY: JANN SWANSON

Black Knight has good news for potential homebuyers, especially those in the market for their first home. The new edition of the company's Mortgage Monitor says the recent decline in mortgage interest rates has made home affordability the best it has been in 18 months.

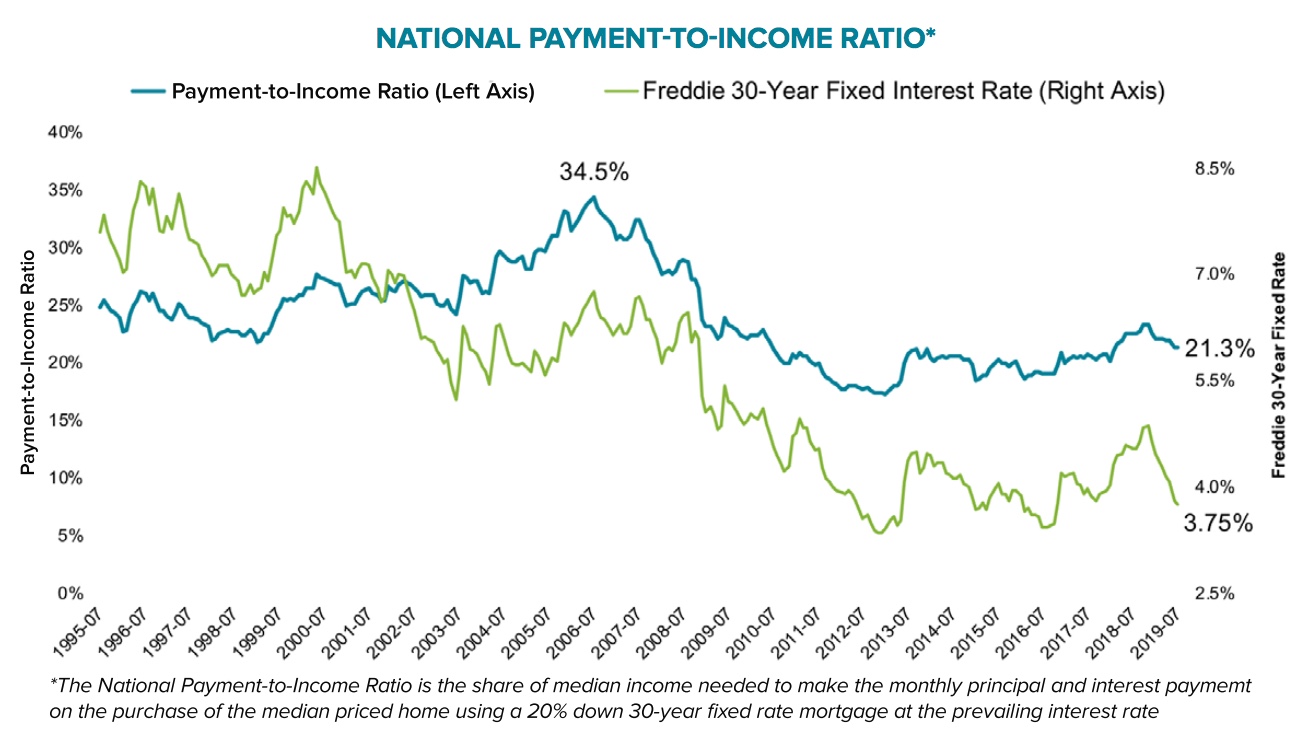
With the 30-year fixed-rate mortgage hovering around 3.75 percent, it now takes 21.3 percent of the nation's median monthly income to make a mortgage payment on the median priced home. This is down from 23.3 percent in November of last year and more affordable than the long-term ratio of around 25 percent that was in-play during a time when the market was generally considered to be "normal," 1995 to 2003. It is also much lower than the 34.5 percent ratio at the height of the housing boom.

The rising payment-to-income ratio, as it hit its recent peak last November, appeared to trigger a strong reaction in both sales and home prices.  Given its relatively modest historical position, Black Knight suggests there may be heightened sensitivity to affordability concerns in today's market. Both existing and new home sales have been ragged since then and, although home prices continued to rise, that rate at which they did so slowed considerably.

The average home price has gone up by more than $12 thousand since interest rates peaked last November, but the monthly payment has declined by $108 for an average home purchased with a 20 percent down payment.  Black Knight says this is the equivalent of a 15 percent increase in buying power and means a homebuyer could pay $45,000 more for a home without seeing an increase in the monthly payment.

payment to income ratio.jpeg

Of course, with lower rates and higher affordability, demand is growing again.  The company notes that, the 15-month pattern of price deceleration it had been tracking seems to have leveled off. The annual home price appreciation rate held steady in June at 3.78 percent.

Black Knight cautions that it takes time for impacts for interest rate changes to show up in housing market numbers; even after homebuyers react, there is a time lag due to contract, offer, closing, and recording times.  Therefore, the flat appreciation rate from May to June could be just the beginning and the 3.75 interest rate that hit at the end of June may not show up in home sale and price changes until August or September.

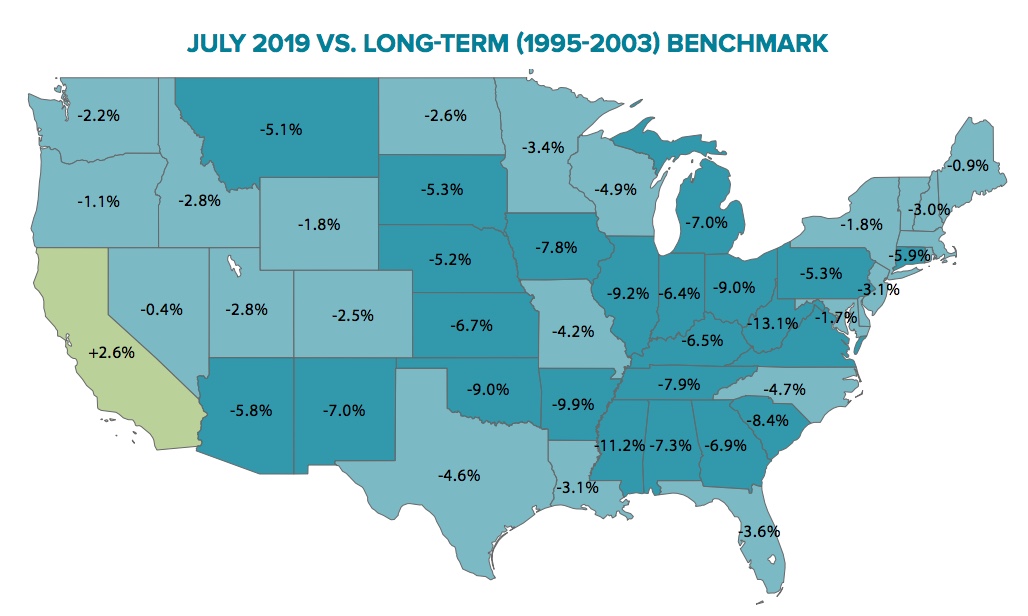
There is a large spread of payment to income ratios across the states, but affordability is improving.  Where nine states were less affordable than their long-term norms back in November, only California and Hawaii remained so as of July.

payment to income ratio by state.jpeg

Housing is least affordable along the western U.S. and parts of the northeast, while the Midwest and parts of the South are home to some of the lowest payment-to-income ratios.  Not only is housing in the Midwest the most affordable, but it is also the furthest below its own long-term average, as income growth there has been more in line with home price growth than in other areas.

july 2019 vs long term.jpeg

Even in California, however, affordability has improved.  The state went from having one of the top five home price growth rates of any state (8.6 percent) one year ago to second-to-last as of June 2019, with home price growth slowing to just 1.3 percent year-over-year.  The payment ratio in the state is now 34 percent, down 4 percentage point from November. That is, however, 2.5 points above its long-term ratio.  Growth declines in several of the West Coast's largest markets has been significant up; prices in the last 12 months have increased by 1.1 percent or less in Los Angeles, San Francisco, San Diego and Seattle. 

Price growth among condominiums have been experiencing greater slowing over the last 12 months than have prices of single-family homes. Up until then the two sets of prices had been rising in lockstep, but now condos are appreciating at 2.2 percent compared to single-family homes at 3.9 percent.  That is a 40 percent differential.  The company points out that condo prices are historically more volatile, they had a faster appreciation rate in the late 1990s and early 2000s, experienced a sharper downturn during the financial crisis and then recovered faster in 2012 to 2014.  Now the tide may be turning again.  The company said this could be due to a number of factors and it worth keeping an eye on.

Black Knight also provided an update on the prepayment rate which had been seeing some dramatic increases as rates declined. That, however, ended in June as activity fell by 7.5 percent.  It was the first monthly decline since January and the company calls it surprising "given that refinance incentive continues to rise, and home sale driven prepayments typically increase from May to June."


prepayment rate by investor.jpeg

 The declines were evident across servicing portfolios, investor classes, interest type and vintages but the strongest reductions were among portfolio held loans, high credit score mortgages and loans originated last year.  Those were the cohorts that had seen the largest increase in prepayments previous to June.  Black Knight says the pullback may be due to sluggish refi-driven prepayments in June rather than (or potentially in combination with) lackluster home sale driven prepays

Mortgage Rates Hold Steady Despite Bond Market Weakness

Mortgage rates side-stepped today, bringing an end to a gentle but consistent move lower over the past 5 business days.  During that time the average conventional 30yr fixed rates for top tier scenarios fell about an eighth of a percentage point (0.125%).  While that only translates to about $7 per month for every $100k financed, it's a pretty decent move historically speaking.  Today's bond market momentum suggests the move could be in jeopardy. 

Bonds are the most direct source of inspiration for mortgage rates, and indeed, for rates in general.  The 10yr Treasury yield tends to track mortgage rates exceptionally well, and it was roughly 0.03% higher today.  The average lender, on the other hand, didn't change mortgage rates at all.  This has to do with the separate set of bonds specifically tied to mortgages: the aptly-named Mortgage-Backed Securities (MBS).  These held steadier today for a variety of reasons.  Simply put, Treasuries had a certain set of concerns not shared by MBS.  

All of the above having been said, if Treasuries lose enough ground, mortgages will eventually be forced to follow due to the structure of the bond market.  Lenders didn't see quite enough weakness for that to happen today, but they'll be starting the day with itchy trigger fingers when it comes to bumping rates up tomorrow.

Today's Most Prevalent Rates

  • 30YR FIXED - 3.875%

  • FHA/VA - 3.625%

  • 15 YEAR FIXED - 3.5-3.625%

  • 5 YEAR ARMS - 3.375-3.75% depending on the lender


Ongoing Lock/Float Considerations
 

  • Early 2019 saw a rapid reevaluation of big-picture trends in rates and in markets in general.

  • The Federal Reserve has been a key player, and while they aren't the ones pulling the global economic strings, their response (and even their EXPECTED response) to the economy has helped rates fall more quickly than they otherwise might.

  • Based on the Fed's laundry list of concerns, the bond market (which determines rates) will be watching economic data closely, both at home and abroad, as well as trade-related concerns. The stronger the data and trade relations, the more rates could rise, while weaker data and trade wars will lead to new long-term lows.

  • Rates discussed refer to the most frequently-quoted, conforming, conventional 30yr fixed rate for top tier borrowers among average to well-priced lenders. The rates generally assume little-to-no origination or discount except as noted when applicable. Rates appearing on this page are "effective rates" that take day-to-day changes in upfront costs into consideration.

Article by Matthew Graham, Chief Operating Officer, Mortgage News Daily / MBS Live