Real Estate News Update

5 Simple Graphs Proving This is NOT Like Last Time

With all of the volatility in the stock market and uncertainty about the Coronavirus (COVID-19), some are concerned we may be headed for another housing crash like the one we experienced from 2006-2008. The feeling is understandable. Ali Wolf, Director of Economic Research at the real estate consulting firm Meyers Research, addressed this point in a recent interview:

“With people having PTSD from the last time, they’re still afraid of buying at the wrong time.”

There are many reasons, however, indicating this real estate market is nothing like 2008. Here are five visuals to show the dramatic differences.

1. Mortgage standards are nothing like they were back then.

During the housing bubble, it was difficult NOT to get a mortgage. Today, it is tough to qualify. The Mortgage Bankers’ Association releases a Mortgage Credit Availability Index which is “a summary measure which indicates the availability of mortgage credit at a point in time.” The higher the index, the easier it is to get a mortgage. As shown below, during the housing bubble, the index skyrocketed. Currently, the index shows how getting a mortgage is even more difficult than it was before the bubble.

Kate_Spad_Blog_Historic_Data_for_the_Mortgage_Credit_Availability_Index.jpg

2. Prices are not soaring out of control.

Below is a graph showing annual house appreciation over the past six years, compared to the six years leading up to the height of the housing bubble. Though price appreciation has been quite strong recently, it is nowhere near the rise in prices that preceded the crash.

Kate_Spad_Blog_Annual_Home_Price_Appreciation.jpg

There’s a stark difference between these two periods of time. Normal appreciation is 3.6%, so while current appreciation is higher than the historic norm, it’s certainly not accelerating beyond control as it did in the early 2000s.

3. We don’t have a surplus of homes on the market. We have a shortage.

The months’ supply of inventory needed to sustain a normal real estate market is approximately six months. Anything more than that is an overabundance and will causes prices to depreciate. Anything less than that is a shortage and will lead to continued appreciation. As the next graph shows, there were too many homes for sale in 2007, and that caused prices to tumble. Today, there’s a shortage of inventory which is causing an acceleration in home values.

Kate_Spad_Blog_Monthly_Inventory_of_Hpmes_for_Sale.jpg

4. Houses became too expensive to buy.

The affordability formula has three components: the price of the home, the wages earned by the purchaser, and the mortgage rate available at the time. Fourteen years ago, prices were high, wages were low, and mortgage rates were over 6%. Today, prices are still high. Wages, however, have increased and the mortgage rate is about 3.5%. That means the average family pays less of their monthly income toward their mortgage payment than they did back then. Here’s a graph showing that difference:

Kate_Spad_Blog_Percent_of_Median_Income_Needed_to_Purchase_a_Median_Priced_Home.jpg

5. People are equity rich, not tapped out.

In the run-up to the housing bubble, homeowners were using their homes as a personal ATM machine. Many immediately withdrew their equity once it built up, and they learned their lesson in the process. Prices have risen nicely over the last few years, leading to over fifty percent of homes in the country having greater than 50% equity. But owners have not been tapping into it like the last time. Here is a table comparing the equity withdrawal over the last three years compared to 2005, 2006, and 2007. Homeowners have cashed out over $500 billion dollars less than before:

Kate_Spad_Blog_Total_Home_Equity_Cashed_Out.jpg

During the crash, home values began to fall, and sellers found themselves in a negative equity situation (where the amount of the mortgage they owned was greater than the value of their home). Some decided to walk away from their homes, and that led to a rash of distressed property listings (foreclosures and short sales), which sold at huge discounts, thus lowering the value of other homes in the area. That can’t happen today.

Bottom Line

If you’re concerned we’re making the same mistakes that led to the housing crash, take a look at the charts and graphs above to help alleviate your fears.

A Look at Home Sales Across the Country by Region

Existing-home sales have been fluctuating in recent months, but one clear trend is emerging: First-time home buyers are making a move into the housing market as low mortgage rates prove to be an enticing incentive.

Lawrence Yun, chief economist for the National Association of REALTORS®, says he’s encouraged by the upturn in first-time home buyers in NAR’s latest existing-home sales report. First-timers comprised 32% of sales last month, up from 29% a year ago, according to NAR. “It’s good to see first-time buyers slowly stepping into the market,” Yun says. “The rise in the homeownership rate among younger adults under 35 and minority households means an increasing number of Americans can build wealth by owning real estate. Still, in order to further expand opportunities, significantly more inventory and home construction are needed at the affordable price points.”

The national homeownership rate has been rising strongly among people younger than 35, increasing from 35.4% in early 2019 to 37.6% in late 2019, Yun adds. Across age groups, existing-home sales are off to a “strong start” at 5.46 million for 2020, Yun says. “The trend line for housing starts is increasing and showing steady improvement, which should ultimately lead to more home sales.”

However, overall sales in January dipped month over month due mostly to the Western region of the country. Overall, existing-home sales—which include completed transactions for single-family homes, townhomes, condos, and co-ops—fell 1.3% compared to December. Still, home sales are up annually for the second consecutive month, with the latest numbers showing a 9.6% gain year over year in January, NAR’s housing report shows.

Here’s a closer look at key indicators from NAR’s latest housing report:

  • Home prices: The median existing-home price for all housing types in January was $266,300, up 6.8% from a year ago. Prices rose in every region last month. “Mortgage rates have helped with affordability, but it is supply conditions that are driving price growth,” Yun says.

  • Inventories: The total housing inventory at the end of January was 1.42 million units, down 10.7% from a year ago. Housing inventories are at the lowest levels for January since 1999. Unsold inventory is at a 3.1-month supply at the current sales pace.

  • Days on the market: Forty-two percent of homes sold in January were on the market for less than a month. Properties stayed on the market for a median of 43 days in January, down from 49 days a year ago.

  • All-cash sales: All-cash sales accounted for 21% of transactions in January, down from 23% a year ago. Individual investors and second-home buyers account for the largest bulk of cash sales. They purchased 17% of homes in January, up slightly from 16% a year ago.

  • Distressed sales: Foreclosures and short sales comprised just 2% of sales in January, down from a year ago.

Regional Sales Snapshot

  • Midwest: sales rose 2.4% in the region, reaching an annual rate of 1.29 million, up 8.4% from a year ago. Median price: $200,000, up 5.4% from January 2019

  • South: sales increased 0.4% to an annual rate of 2.38 million in January, up 11.7% from a year ago. Median price: $229,000—a 6.3% increase from a year ago

  • West: sales decreased 9.4% in January to an annual rate of 10.6 million, still an 8.2% increase compared to a year ago. Median price: $393,800, up 5.2% from a year ago

  • Northeast: sales saw no major movement in January compared to December, remaining at an annual rate of 730,000. That is up, however, 7.4% from a year ago. Median price: $312,100—up 11.5% from a year ago

Source:  National Association of REALTORS®

$100 Million in U.S. Tax Credits to go Toward Housing in Wildfire Areas, Including Napa

“Under pressure from fire survivors and elected officials, California Treasurer Fiona Ma said Friday that $100 million in new federal tax credits will be used as intended to pay for housing projects in 13 counties — including Napa County — that suffered devastation during wildfires in 2017 and 2018.

Sonoma County business and elected leaders had expressed concerns last month that the tax credits might be diverted for homeless housing developments, after a state committee overseen by Ma released planned guidelines for the use of the funding. They insisted the tax credits should be used for housing in fire-affected areas including the North Bay in 2017.

“We want to make it crystal clear that these tax credits are going to help counties that have been devastated by disasters,” Ma said in a prepared statement. “I salute the resilience, dedication, and creativity of these communities and I’m glad we can help them rebuild.”

Ma is chairwoman of the California Tax Credit Allocation Committee, which awards and distributes the federal tax credits. She said in Friday’s statement she is revising the committee’s regulations to give communities in 13 counties torched by infernos until the end of 2021 to seek credits for housing projects. The counties are: Butte, Lake, Los Angeles, Mendocino, Napa, Nevada, Orange, San Diego, Santa Barbara, Shasta, Sonoma, Ventura and Yuba.

Last year, Rep. Mike Thompson, D- Napa, wrote federal legislation directing additional tax credits for the 13 fire- ravaged counties statewide.

After the state treasurer’s office had released proposed guidelines for allocating the additional federal low-income housing tax credits, Thompson expressed his concerns in a Jan. 22 letter to Ma.

Late last month, Sonoma County Supervisor Lynda Hopkins said that, while she understands the urgent need for homeless housing, these federal tax credits should be used only for wildfire disaster recovery. The county lost 5,300 homes in the Tubbs inferno in October 2017 and continues to rebuild.

Federal low-income housing tax credits are the single most important tool used to finance and build affordable housing, said Larry Florin, executive director of nonprofit Burbank Housing based in Santa Rosa.

Developers like Burbank who receive such tax credits can sell the credits to investors such as banks. In this case, the purchased credit can be used as a tax break over 10 years.

“So the $100 million in tax credits becomes $1 billion over that period,” Florin said last month.

Florin and other Sonoma County leaders said previously if the state officials allocate the tax credits according to the damage caused by recent wildfires, North Bay and Northern California counties would end up getting about 30% of the tax credits.

State Sen. Mike McGuire, D-Healdsburg, commended Ma for her clarification Friday on the use of the federal funds.

“This $100 million in tax credits will be a huge shot in the arm for the rebuilding of our communities and desperately needed affordable housing,” McGuire said.”

By: Bill Swindell The Press Democrat

A Lineup of Napa Wine Country Controversies are Coming Back for Hearings

“Several Napa County wine country growth controversies are getting second lives, starting with the recently approved Hard Six Cellars winery along Diamond Mountain Road near Calistoga.

The county Planning Commission heard these cases and rendered decisions. Opponents to the outcomes have filed appeals with the Board of Supervisors.

Hard Six Cellars is an example of a proposed winery that some rural neighbors say is too ambitious for a remote, mountainous location. The Board of Supervisors is to hear the appeal at 9:30 am. Tuesday at the county administration building, 1195 Third St. in Napa.

The Planning Commission approved the winery in October. Appellants Martin Checov and Timothy Bause in the appeal say the project “must now be sent back to the drawing board.”

Among other things, they claim Diamond Mountain Road – “a dilapidated mountain road that is frequently strewn with forest debris” – is unsuitable for the amount of car, bus and truck trips to be generated by the winery. They note that Diamond Mountain is considered by Cal Fire to be at high risk for wildfires.

A county report responds that the Planning Commission didn’t ignore Diamond Mountain conditions. Commissioners considered the opinions of licensed traffic professional and fire officials.

County staff recommends denial of the appeal, which would result in approval of the winery. The Board of Supervisors will make the call.

Meanwhile, other appeals loom. They include:

Bremer Family Winery – This is only the latest controversy involving the Bremer winery near Deer Park in the mountains northeast of St. Helena.

The county sued the winery in 2017 over numerous alleged code violations. A 2019 settlement among other things directed the Bremers to try to legalize footbridges and other structures along a stream – some built prior to their ownership – before the Planning Commission.

In October, the Planning Commission approved the structures within a stream setback by a 3-2 vote. Angwin resident Mike Hackett and Advocates for the Public Trust filed an appeal.

“They are using public trust space to sell wine,” Hackett told the Planning Commission in October. “Are we going to penalize them or are we going to reward them? I think it’s very important you set a precedent for future violators.”

A Planning Commission majority didn’t want the Bremers to have to remove the structures. However, Commissioner Joelle Gallagher expressed concerned that the Bremers’ request was entangled with the lawsuit settlement that didn’t contemplate Planning Commission denial.

Hackett in the appeal writes that the Board of Supervisors cannot hear the appeal due to a conflict of interest, given the county entered into the settlement agreement. He is asking the Board of Supervisors to recuse itself.

The appeal was to be discussed by the Board of Supervisors last Tuesday. The Board continued the matter until March 17.

Mathew Bruno Tasting Room – This project approved by the Planning Commission in December involves turning an 1890s-era Victorian home in Rutherford into a tasting room.

“We knew this would be a great place for a family to enjoy our wines in a setting in Rutherford,” Anthony Bruno told the commission.

The home is at the entrance to Grape Lane, a narrow, private road serving several homes. The Grape Lane Association has traffic concerns, among them plans for tasting room parking stalls next to their access road.

Planning commissioners decided the applicants were doing enough to meet the neighborhood concerns. The Grape Lane Association disagreed.

Attorney Tom Carey wrote the appeal on behalf of the association. Among other things, he pointed to changes made by the Planning Commission at the meeting to try to address concerns.

“Because these revisions were made at the same hearing at which the project was approved, the neighbors not present at the hearing had no prior notice of these changes,” Carey wrote.

Mountain Peak Winery – This is another case raising questions of how big a winery should be allowed in the mountains along a narrow road.

The Board of Supervisors heard an appeal in May 2017 and approved this winery to be built at the end of Soda Canyon Road. But supervisors may have more work to do.

Opponents brought the case to Napa County Superior Court. The court last summer ruled the Board of Supervisors should reconsider the issue based on new information on safety in light of the October 2017 Atlas fire that burned much of Soda Canyon.

Project proponents have challenged this ruling in the state 1st District Court of Appeal.

Walt Ranch – This controversial project involves planting vineyards in the mountains between the city of Napa and Lake Berryessa.

The Board of Supervisors in 2016 approved the project, leading to a court challenge by opponents. An issue has arisen over greenhouse gas mitigation.

Walt Ranch intends to mitigate for the loss of 14,000 carbon-sequestering trees by preserving woodlands. The 1st District Court of Appeal in October questioned whether the woodlands to be preserved are in danger of being cut down.

How and when this issue will be resolved remains to be seen.”

By: BARRY EBERLING beberling@napanews.com

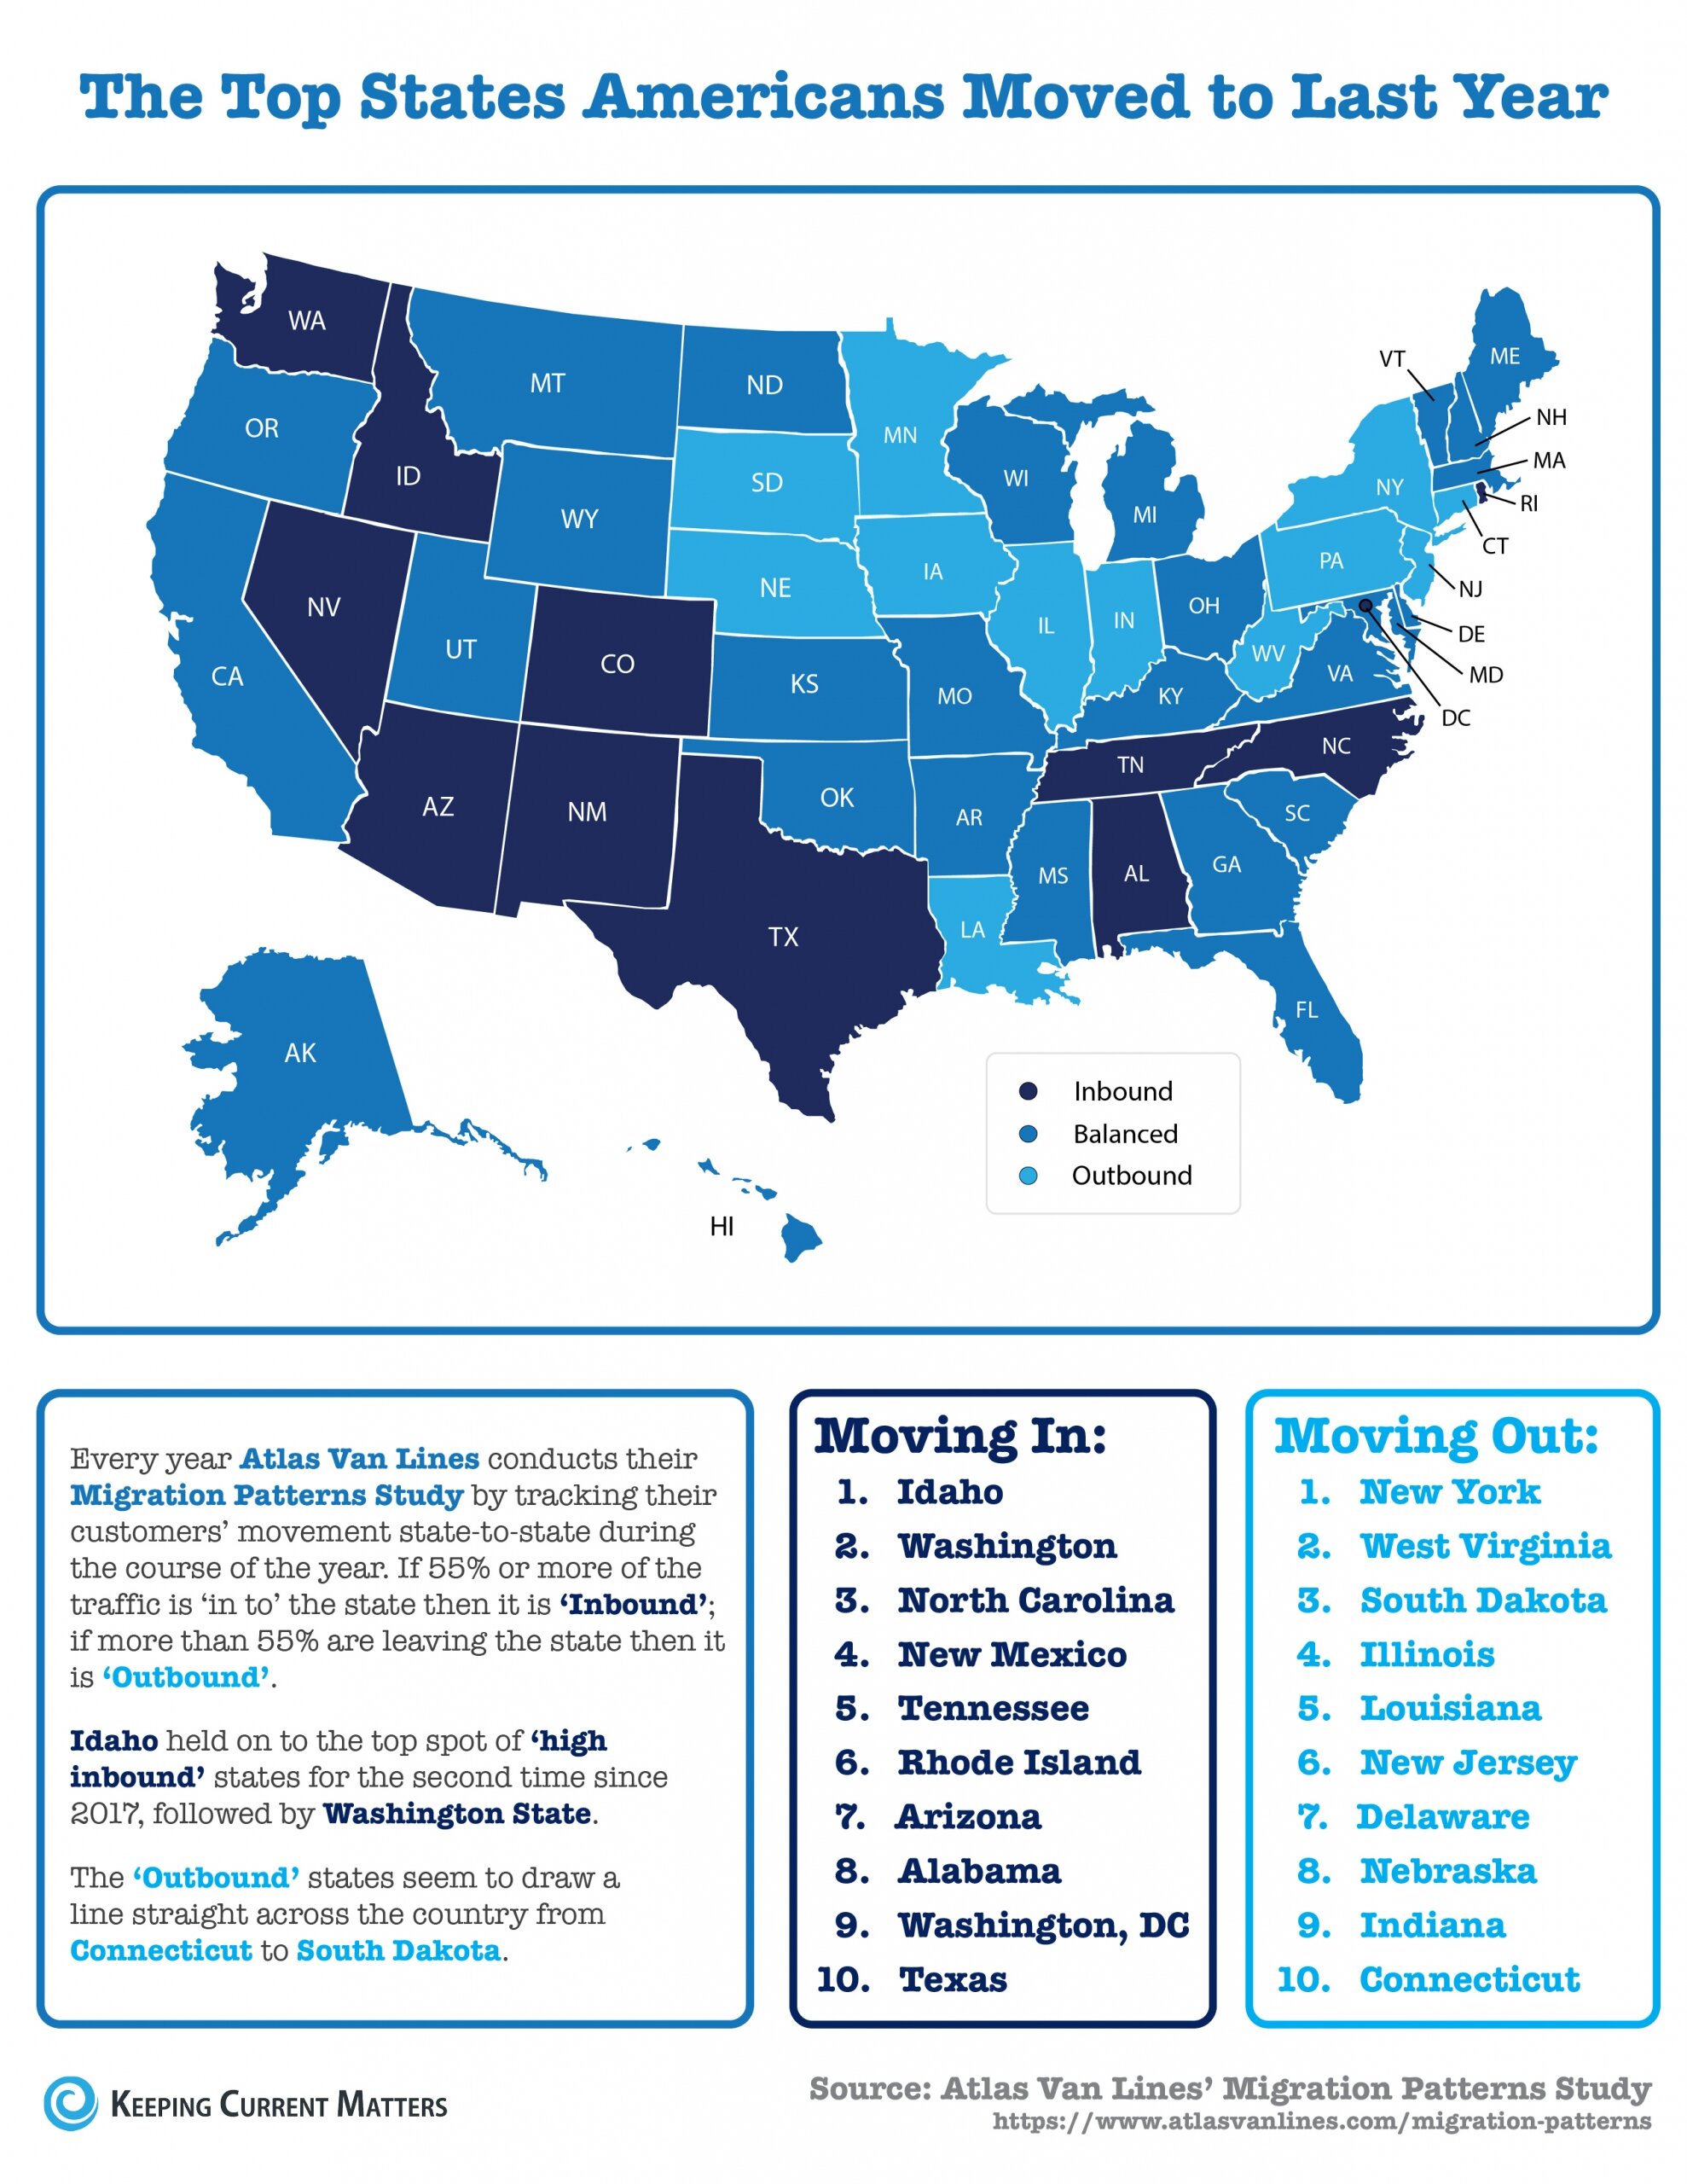
The Top States Americans Moved to Last Year

Kate_Spad_Blog_The_Top_States_Americans_Moved_To_Last Year.jpg

Some Highlights:

  • Americans are on the move, and the most recent Atlas Van Lines Migration Patterns Survey tracked the 2019 traffic flow from state-to-state.

  • Idaho held on to the top spot of ‘high inbound’ states for the second time since 2017, followed by Washington State.

  • New York was the country’s outbound move leader in 2019, a designation it most recently held in 2014.

Mortgage Rates Digging Deeper Into Multi-Year Lows

BY: MATTHEW GRAHAM

Feb 3 2020, 5:39PM

In the world of interest rates, it's good to be a mortgage today.  The dominant species on that world is US Treasuries: the quintessential dollar-based loans (after all, they are loans to the US government).  Loaning dollars to the entity responsible for the dollar is about as foundational as it gets, but I digress.

Treasuries and mortgage rates tend to move in the same direction and by generally similar amounts. That's because mortgage rates are based on underlying bonds (mortgage-backed securities or "MBS") that are fairly similar to Treasuries in most of the ways investors care about.  The prices of MBS dictate where lenders can and should set their interest rates, but ultimately, it's up to the lender.  If they're flush with business and want to slow things down, they might set rates a bit higher.  The same thing can happen heading into a weekend during times of elevated volatility.

Such was the case on Friday.  Lenders had a nice improvement in MBS to work with.  It allowed them to lower rates a bit more than they actually did.  Now, as the new week begins, Treasury yields and MBS alike are indicating slightly higher rates than Friday, but because lenders played it so safe, they were instead able to offer slightly LOWER rates today.  Simply put, mortgage rates are even deeper into multi-year lows now, even though the bond market is pointing to slightly higher rates versus last Friday. 


Loan Originator Perspective

Bond yields hit a bit of a wall Monday, moving upward from Friday's multi-year lows, amid upbeat economic data and potential progress on a Wuhan virus treatment.  We may not be at the very lowest yields here, but it'd take monumentally horrible news to move rates much lower.  I am locking loans closing within 45 days for all but the most risk craving clients.  - Ted Rood, Senior Originator


Today's Most Prevalent Rates For Top Tier Scenarios 

  • 30YR FIXED - 3.375-3.5%

  • FHA/VA - 3.125 - 3.25%

  • 15 YEAR FIXED - 3.125-3.25% 

  • 5 YEAR ARMS -  3.25-3.75% depending on the lender


Ongoing Lock/Float Considerations 

  • 2019 was the best year for mortgage rates since 2011.  Big, long-lasting improvements such as this one are increasingly susceptible to bounces/corrections 

  • Fed policy and the US/China trade war have been key players (and more recently, the coronavirus outbreak).  Major updates on either front could cause a volatile reaction in rates.  

  • The Fed and the bond market (which dictates rates) will be watching economic data closely, both at home and abroad, as well as updates on other factors like trade and viral epidemics. The stronger the data the more rates could rise, while weaker data will lead to new long-term lows.  

  • Rates discussed refer to the most frequently-quoted, conforming, conventional 30yr fixed rate for top tier borrowers among average to well-priced lenders.  The rates generally assume little-to-no origination or discount except as noted when applicable.  Rates appearing on this page are "effective rates" that take day-to-day changes in upfront costs into consideration.

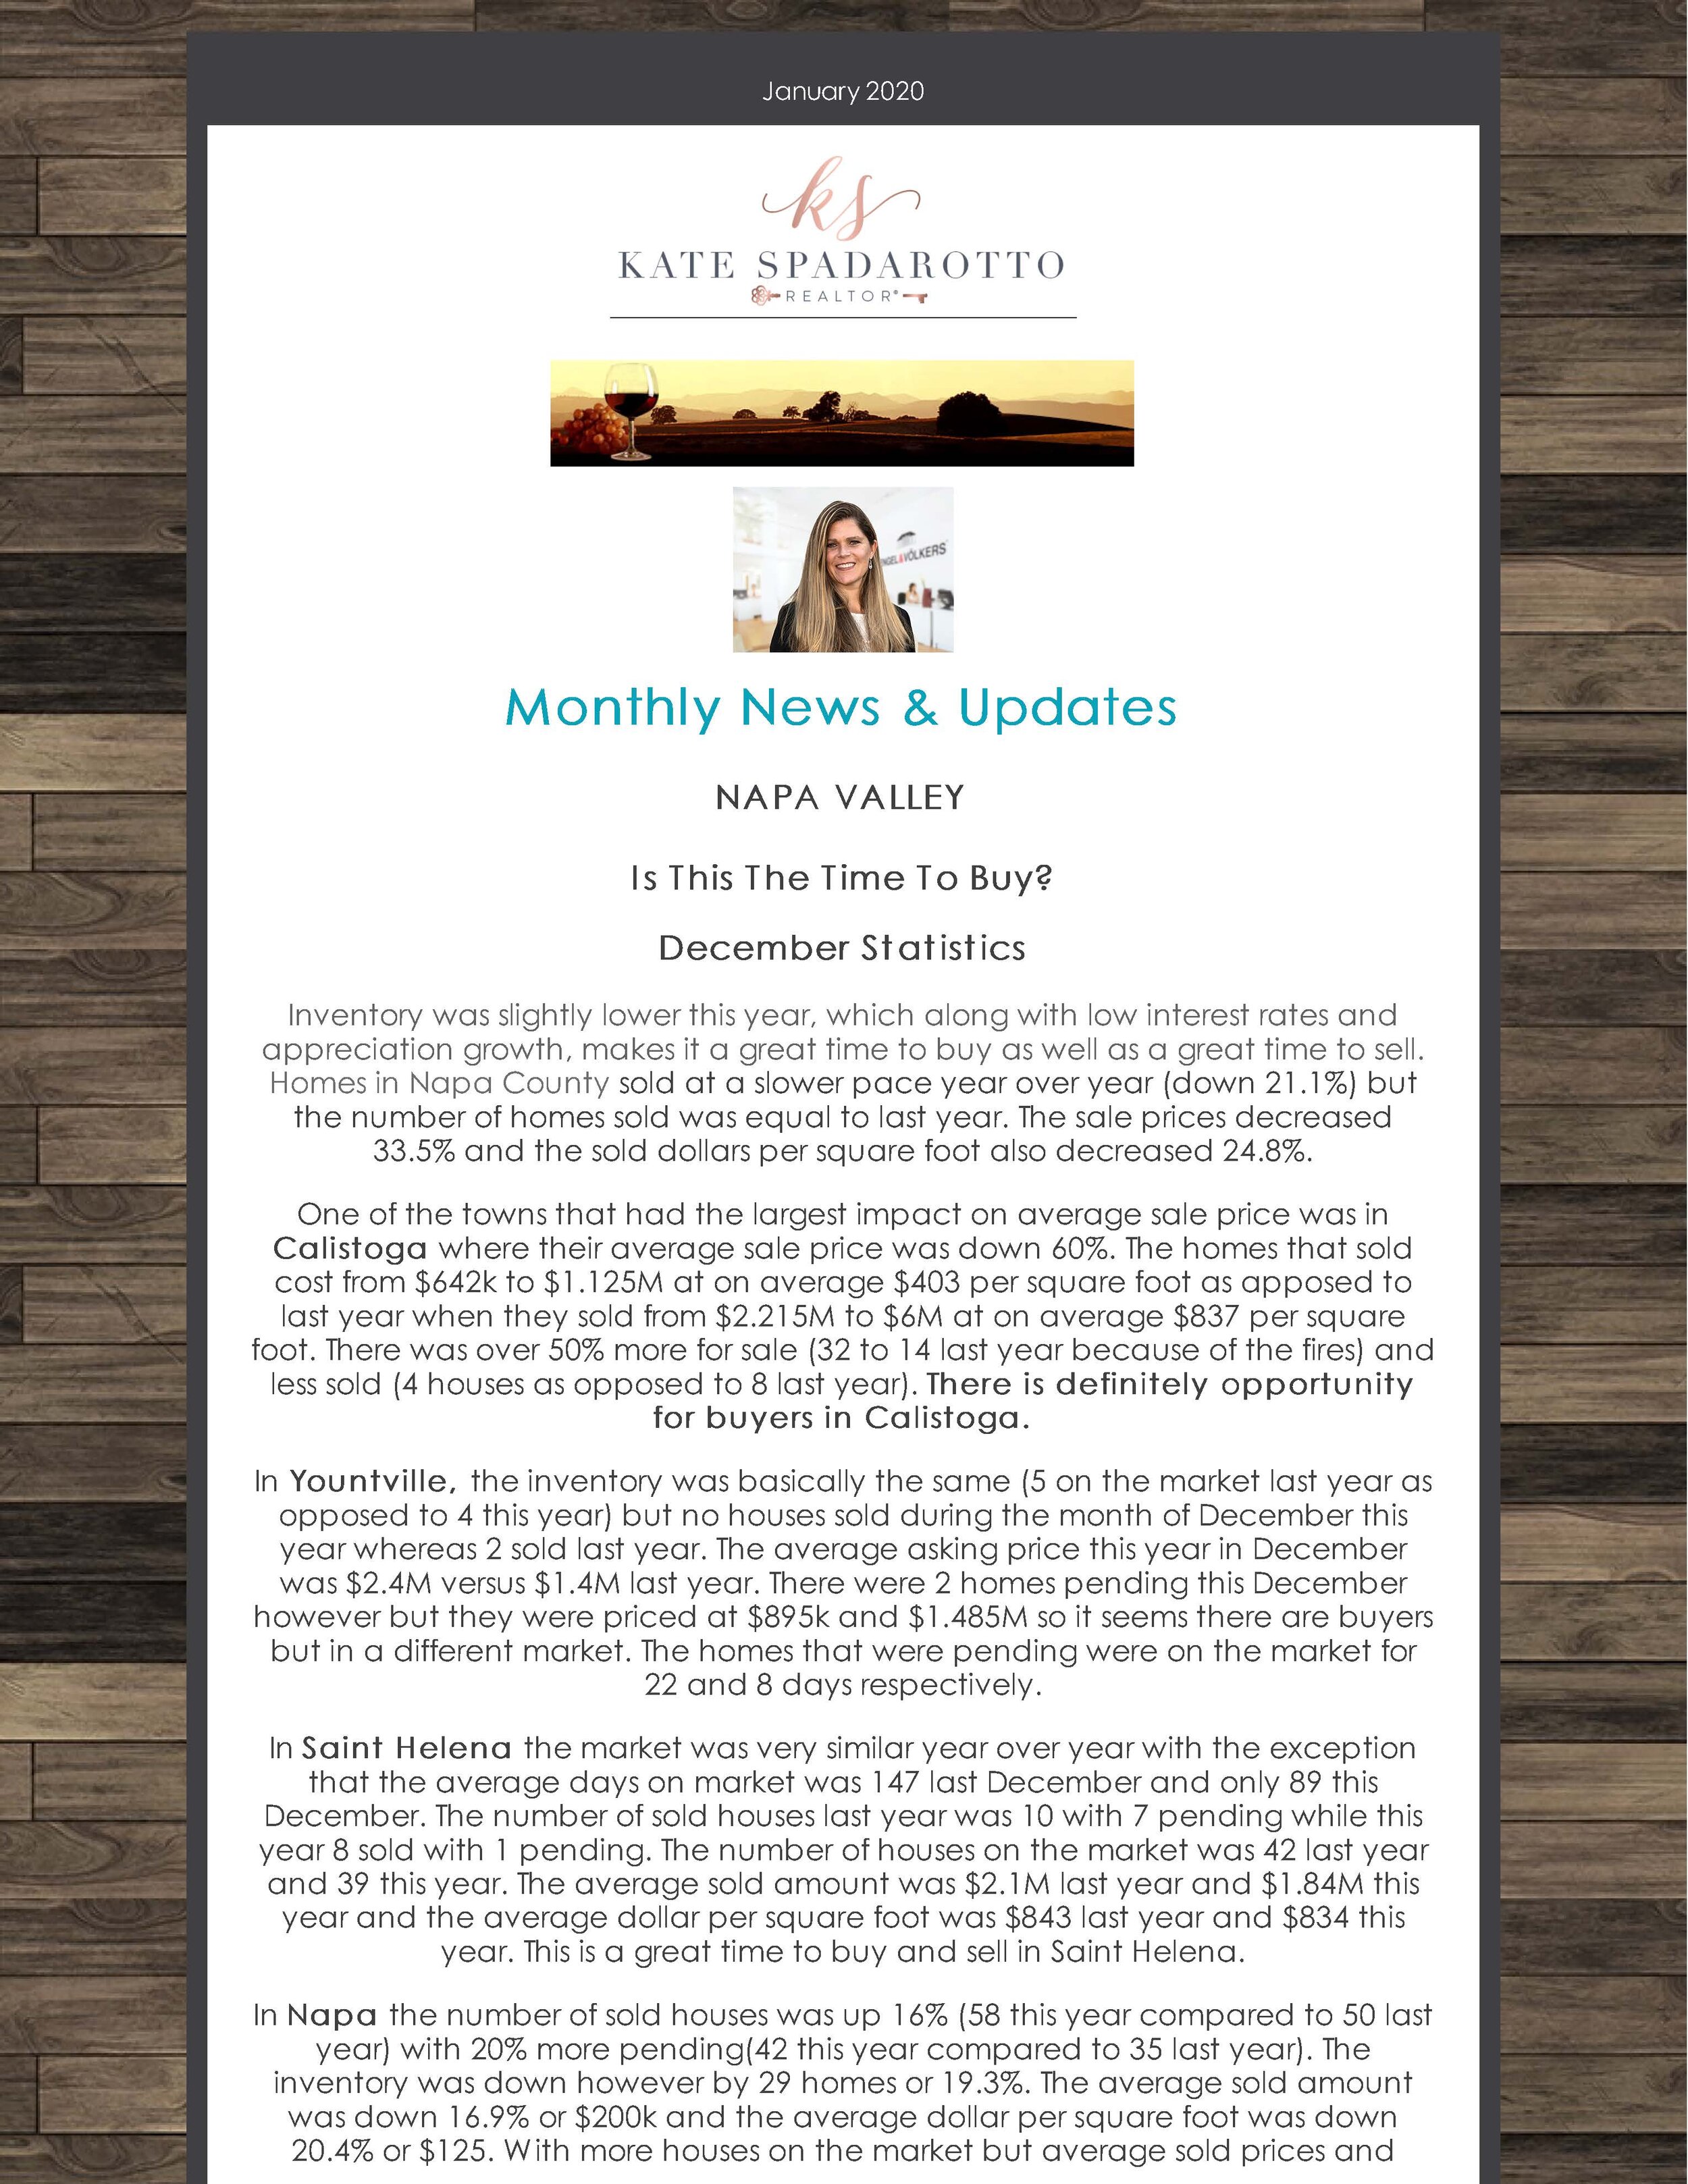
January 2020 Real Estate News Update

Kate_Spad_Blog_January_2020_Real_Estate_News _Updates_Page_1.jpg
Kate_Spad_Blog_January_2020_Real_Estate_News _Updates_Page_2.jpg
Kate_Spad_Blog_January_2020_Real_Estate_News _Updates_Page_3.jpg

Holiday Gifts Are Not the Only Hot Things Right Now

Black Friday is behind us and holiday gifts are flying off the shelves in stores and online. Unlike last year, however, there’s another type of buyer that is very active this winter – the homebuyer.

Each month, ShowingTime releases their Showing Index, which tracks the average number of appointments received on active U.S. house listings. The latest index revealed:

“Traffic was more active once again compared to 2018, as the nation saw its third straight month of higher year-over-year showing activity…The 5.5% increase in showings nationwide was the largest jump in activity during the now three-month streak of year-over-year increases vs. 2018.”

The same report indicates showings increased in every region of the country:

  • The South increased by 10.8%

  • The West increased by 8.6%

  • The Northeast increased by 3.8%

  • The Midwest increased by 1.5%

Why is the traffic more active?

One of the main reasons buyer traffic has increased year-over-year is that mortgage rates have fallen dramatically. According to Freddie Mac, the average mortgage rate last December was 4.64%. Today, the rate is almost a full percentage point lower!

Bottom Line

There are first-time, move-up, and move-down buyers actively looking for the home of their dreams this winter. If you’re thinking of selling your house in 2020, you don’t need to wait until the spring to do it. Your potential buyer may be searching for a home in your neighborhood right now.

December 2019 Real Estate News & Updates

Please let me know if you would like to receive my monthly newsletter by messaging me your email address. I promise this will be the only thing I will email you and I will not share your email address.

Thank you,

Kate Spadarotto

December 2019 Real Estate News Updates_Page_1.jpg
December 2019 Real Estate News Updates_Page_2.jpg

Summer Housing Boom Not Quite Done Yet According to Pending Sales

Pending home sales resumed their upward trajectory in August after declining 2.5 percent in July, making for positive results in three of the last four months. It was also the third winning sales report this month after solid existing and new home sales.

The National Association of Realtors'® (NAR's) Pending Home Sales Index is a leading indicator of existing home sales based on signed contracts to purchase those homes.  It rose 1.6 percent to 107.3 in August from a July reading of 105.6.  This puts pending sales 2.5 percent higher than in the previous August.

The number was at the high end of analysts projections. Those polled by Econoday had expected pending sales to be anywhere from flat compared to July to a 1.8 percent gain.  The consensus was an increase of 0.6 percent.

The index rose in all regions, but the West put in the best performance, with a 3.1 percent increase to 96.4.  This would put it 8.0 percent higher year-over-year. Pending sales in the Northeast rose 1.4 percent for the month and 0.7 percent on an annual basis to 94.3.

The Midwest posted a 0.6 percent gain to 101.7 in August and was 0.2 percent higher than a year earlier. The South's PHSI rose 1.4 percent to 124.4, a 1.8 percent annual bump.

NAR Chief Economists Lawrence Yun said, "It is very encouraging that buyers are responding to exceptionally low interest rates.  The notable sales slump in the West region over recent years appears to be over. Rising demand will reaccelerate home price appreciation in the absence of more supply."

He noted that historically low interest rates will affect economic growth, especially home buying, going forward. "With interest rates expected to remain low, home sales are forecasted to rise in the coming months and into 2020," said Yun. "Unfortunately, so far in 2019, new home construction is down 2.0 percent. The hope is that housing starts quickly move into higher gear to meet the higher demand. Moreover, broader economic growth will strengthen from increased housing activity."

With sales picking up, NAR is forecasting they will end the year 0.6 percent higher than in 2018 and will grow another 3.4 percent next year. Housing starts are predicted to increase by 2.0 percent in 2019 and jump an additional 10.6 percent in 2020, which in turn raises GDP growth to 2.0 percent in 2020.

The PHSI is a leading indicator of existing home sales and is based on a large national sample, typically representing about 20 percent of transactions for existing-home sales. In developing the model for the Index, it was demonstrated that the level of monthly sales-contract activity parallels the level of closed existing-home sales in the following two months.

 An index of 100 is equal to the average level of contract activity during 2001, which was the first year to be examined. By coincidence, the volume of existing-home sales in 2001 fell within the range of 5.0 to 5.5 million, which is considered normal for the current U.S. population.

BY: JANN SWANSON

Homeownership Equity Reaches All-Time-High in Q2

BY: JANN SWANSON

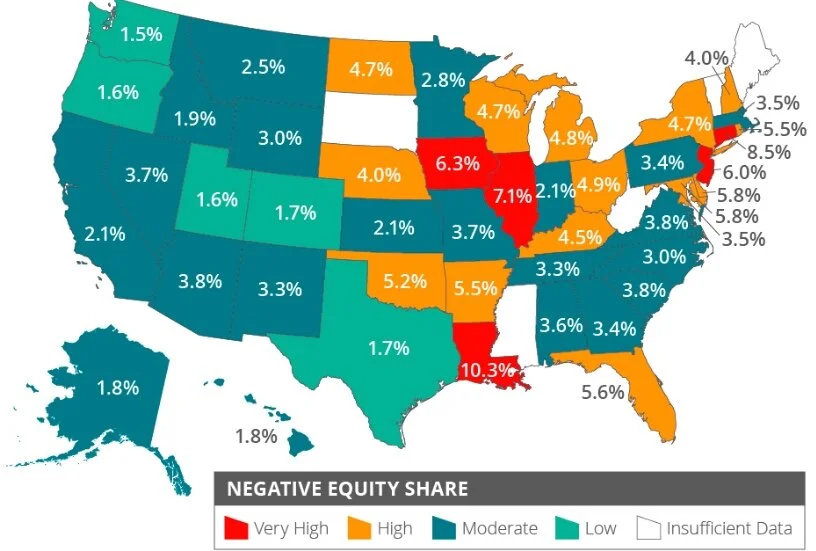
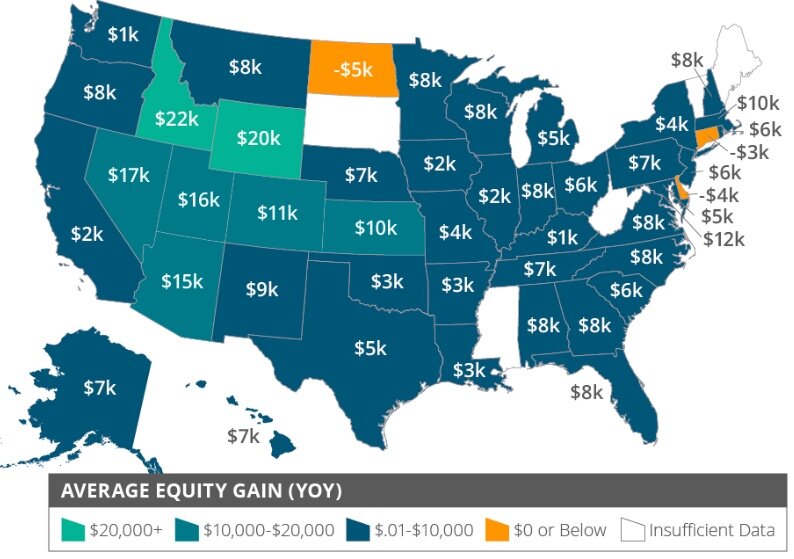
Total home equity, not surprisingly, increased again in the second quarter of the year.  CoreLogic's quarterly Homeowner Equity Insights report, which looks only at properties with one or more mortgages, puts the aggregate increase at $428 billion year-over-year, a 4.8 percent gain.   The company says that 63 percent of residential properties have a mortgage.

"Home values have continued to rise in most parts of the country this year and we are seeing the benefit in higher home equity levels. The western half of the U.S. has experienced particularly strong gains in home equity recently," according to CoreLogic CEO and President Frank Martell. In July 2019, South Dakota and Connecticut were the only two states to post annual home price declines. These losses mirror the states' home equity performances during the second quarter as both reported negative home equity gains per borrower."

The number of mortgage properties that were underwater, owning more on the mortgage or mortgages than the property is worth, totaled 2 million homes or 3.8 percent of all mortgaged properties. This is 151,000 fewer underwater properties (a 9 percent decrease) from the second quarter 2018 total.  At that time the negative equity rate was 4.3 percent.

Frank Nothaft, CoreLogic Chief Economist, said "Borrower equity rose to an all-time high in the first half of 2019 and has more than doubled since the housing recovery started. Combined with low mortgage rates, this rise in home equity supports spending on home improvements and may help improve balance sheets of households who could take out home equity loans to consolidate their debt."

Negative equity at the end of the second quarter of 2019 had an aggregate value of approximately $302.7 billion. This is down quarter over quarter by approximately $2.6 billion, from $305.3 billion in the first quarter of this year.

Negative equity peaked at 26 percent of mortgaged residential properties in the fourth quarter of 2009, based on the CoreLogic equity data analysis which began in the third quarter of 2009.

Kate_Spad_Blog_Sept_21.jpeg

When broken down by household, the aggregate increase in equity averages a gain of $4,900 since the end of Q2 2018. Idaho had the highest year-over-year average increase at $22,100.

Kate_Spad_Blog_Sept_21_2.jpeg


2018's Home Sales Slump Now Fully Erased

BY: JANN SWANSON

While the increase wasn't as strong as in July, last month's existing home sales posted a second straight month of gains and, as previously, the National Association of Realtors® (NAR) credited falling interest rates.  Sales of previously owned single-family houses, townhouses, condominiums, and cooperative apartments were up 1.3 percent compared to July when sales rose 2.5 percent.  The seasonally adjusted annual rate of 5.49 million units was 2.6 percent higher than the August 2018 pace of 5.35 million. The increase was felt in three of the four major regions while the West continues to demonstrate some weakness.

The month's results were better than predicted.  Analysts polled by Econoday had expected them to come in at an annual rate of 5.30 to 5.42 million with a consensus of 5.38 million.

Single-family home sales rose from 4.84 million in July to 4.90 million in August, a 1.2 percent gain and 2.9 percent above the August 2018 rate. Existing condo sales rose 1.7 percent from July to 590,000 annual units, largely unchanged from the previous August.

Lawrence Yun, NAR's chief economist, said, "As expected, buyers are finding it hard to resist the current rates. The desire to take advantage of these promising conditions is leading more buyers to the market."

The median existing home price for all housing types in August was $278,200, up 4.7 percent from the median a year earlier of $265,600.  It was the 90th straight month of year-over-year gains. The median existing single-family home price also rose 4.7 percent to $280,700.  Condo prices were up 5.2 percent to a median of $257,600 in August.

"Sales are up, but inventory numbers remain low and are thereby pushing up home prices," said Yun. "Homebuilders need to ramp up new housing, as the failure to increase construction will put home prices in danger of increasing at a faster pace than income."

Inventory fell in August, down from 1.90 million available homes to 1.86 million and 2.6 percent fewer homes than a year earlier. Unsold inventory is at a 4.1-month supply at the current sales pace, down from 4.2 months in July and from the 4.3-month figure recorded in August 2018. Properties typically remained on the market for 31 days in August, up from 29 days in both July and the prior August. Forty-nine percent of homes sold in August were on the market for less than a month.

Yun criticized the quarter point cut in the Fed Funds rate made by the Federal Reserve on Wednesday.  "[The Fed] should have been bolder and made a deeper rate cut, given current low inflation rates," he said. "The housing sector has been broadly underperforming but there is huge upward potential there that will help our overall economy grow."

First-time buyers were responsible for 31 percent of sales in August, the same as a year and investors and second home buyers accounted for 14 percent, up from 11 percent in July.  All-cash sales accounted for 19 percent of transactions in August, about equal to July and moderately below August 2018. Distressed sales remained negligible, representing 2 percent of August sales, a 1-point decline from a year earlier.

 "Rates continue to be historically low, which is extremely beneficial for everyone buying or selling a home," said NAR President John Smaby. "The new [FHA] condominium loan policies, as well as other reforms NAR is pursuing within our housing finance system, will allow even more families and individuals in this country to reach the American Dream of homeownership."

There were month-over-month increases in existing home sales in the Northeast, Midwest, and South and sales in all four regions bested their 2018 numbers. Sales in the Northeast increased 7.6 percent from July to an annual rate of 710,000 units, 1.4 percent higher than in August 2018. The median price fell 0.3 percent on an annual basis to $303,500.

Existing-home sales grew 3.1 percent in the Midwest to an annual rate of 1.31 million, topping sales from a year earlier by 2.3 percent.  The median price jumped 6.6 percent to $220,000.

In the South there was a gain of 0.9 percent in sales to a rate of 2.33 million and sales were 3.6 percent higher year-over-year. The median price of $240,300 was a 5.4 percent annual increase.

While sales remained 1.8 percent higher on an annual basis, the West was an outlier in August. Existing home sales declined 3.4 percent to 1.14 million. Prices, however, continued their strong appreciation, rising 5.7 percent to $415,900.

The Fed and Mortgage Rates

One of the greatest potential sources of confusion for prospective mortgage borrowers is the relationship between the Fed and mortgage rates.  While the Fed's policy changes absolutely have a big impact on all sorts of interest rates (including mortgages), a drop in the Fed's policy rate DOES NOT result in lower mortgage rates. 

The main reason for confusion is the fact that there's a huge difference from an investment standpoint between a rate that governs the shortest-term transactions (The Fed Funds Rate applies to loans that last for 1 day or less) and a rate that can remain in effect for up to 30 years in the case of mortgages.  Even if we use the average life span of a 30yr fixed mortgage, we're still talking about 5-10 years depending on the broader market landscape. You may have heard about the "inverted yield curve?"  That's a reference to vastly different behavior between longer and shorter term rates, and it stands as evidence of the different sets of concerns that apply to each side of the duration spectrum.  The differences are only more pronounced when we take the shorter end of the spectrum all the way down to the "overnight" level (Fed Funds Rate) and all the way up to the duration of the average mortgage loan.

Beyond the fact that a mortgage rate is very simply a different animal than the Fed Funds Rate, there's also the matter of frequency of movement.  The Fed only meets to potentially change rates 8 times a year.  Mortgage rates change every day--sometimes more than once.  And the bond markets that underlie mortgage rates change thousands of times per day.  That means the mortgage market can easily and quickly get into position for any expected move from the Fed.  In today's case, where the rate cut was seen as highly likely, any effect that the Fed Funds Rate could ever have on mortgage rates was already priced-in weeks ago.

But let's say the first two points don't quite convince you.  The third is irrefutable.  The Fed doesn't just take the stage, cut rates, and go home.  They release a ton of other info and hold a press conference to discuss their present and future policy decisions.  The rates market (for mortgages, Treasuries, and everything else) is tremendously interested in all that "other stuff."  Today, particularly, there was a set of updated forecasts for future rate movements.  These were a bit less market-friendly than the average investor expected.  In addition, market participants interpreted Powell's press conference as being a bit less friendly than expected.

Long story short: there are multiple reasons for mortgage rates to go their own way regardless of the Fed rate cut. 

BY: MATTHEW GRAHAM

Hotel Plans for the Earthquake Damaged Historic Post Office in Downtown Napa

JENNIFER HUFFMAN jhuffman@napanews.com

Developers this week presented the city with refined designs for the approved boutique hotel on the site of the former Franklin Street post office in downtown Napa.

The changes were made after receiving initial comments from Napa County Landmarks and the city’s Planning Commission during a preliminary design review in June.

At that time, some reviewers thought the first version of the wrap around design overwhelmed the post office building and covered too much of it.

“I think we’ve done an over-the-top job” in both preserving and presenting the historic building, said developer Jim Keller. “It’s really exciting.”

Wings of the new hotel still wrap around the old post office building, but in this latest version there are more transparent panels, which allow greater visibility of the post office, located at 1351 Second St.

Not only is his group preserving the front of the building, it’s also preserving the sides as well – something that wasn’t explicitly required, said Keller.

“We came up with a plan that’s really going to have an awesome look,” Keller said. “I think we’ve overachieved as far as the preservation of the building.”

The changes were made after receiving initial comments from Napa County Landmarks and the city’s Planning Commission during a preliminary design review in June.

At that time, some reviewers thought the first version of the wrap around design overwhelmed the post office building and covered too much of it.

The last version was more of a rough draft, compared to the new refined design, Keller said. “We took it up another level or two.”

These new images create what he described as “a jewel box effect,” with the crown jewel – the Art Deco-style post office building — in the middle, said Keller. The historic building is the “obvious the centerpiece and focal point.”

The historic post office lobby would be fully renovated and used as the hotel lobby and bar, accommodating guests as well as the general public, according to design documents. The interior features of the post office will be visible to all, rather than turning the post office into a private office or other commercial use, said the documents.

The Third Street-facing side of the project, currently home to Zeller’s Ace Hardware, has also been refined. “We made that a little more user friendly and broke up some of the massing. The design has been elevated,” yet still fits within the parameters of the already approved project, he said.

Plans call for a 175,000-square-foot, five-story, 156-key hotel using the site of the former post office and adjacent land where Zeller’s Ace Hardware now operates.

A separate, five-story parking garage would be built at the southeast corner of Second and Randolph streets, a corner now used for surface parking.

The project will cost more than $100 million, Keller said.

Keller, a Napa developer, bought the post office building in 2017 for $2 million. He’s since partnered with Cypress Equities, based in Dallas.

The hotel’s footprint will take over much of the block along Second between Franklin and Randolph streets, and along Randolph between Second and Third streets. The Napa City Council granted a rezoning and a building agreement in November 2018.

Having financial partners lined up in advance has helped move the project along, Keller said. Being located within a state-designated Opportunity Zone, which offers tax breaks to investors, is another. Napa has two such zones, including one in downtown Napa.

As the process continues, Keller said he remains mindful of the fragile state of the post office. “If we get hit with another earthquake,” the building might not survive.

“We’re trying to move as fast as we can,” said Keller.

His next steps include final design approval from the Planning Commission and Cultural Heritage Commission. Meeting dates have not been set.

If all goes as planned, “I’m hoping in the next 12 months we can be” under construction, he said. The hotel could take two to three years to build.

The hotel project was never a sure thing. After the 2014 earthquake, the USPS originally moved to demolish the damaged post office building.

The agency said that it would cost $8 million to repair quake damage, while it would cost only $500,000 for demolition.

The Napa Franklin Station was built in 1933 with funding from the federal Public Works Administration. In 1985, it was placed on the National Register of Historic Places.

After considerable public outcry, the USPS decided to try selling the building to a buyer who could repair the structure and preserve its architectural integrity.

Kate_Spadarotto_Blog_Historic_Post_Office.jpg
Kate_Spadarotto_Blog_Historic_Post_Office_Hotel_2.jpg
Kate_Spadarotto_Blog_Historic_Post_Office_Hotel_4.jpg

6 Graphs Showing the Strength of the Current Housing Market

Kate_Spadarotto_Blog_Sept_13_2019.jpg

Some Highlights:

  • Keeping an eye on the current status of the housing market is one of the best ways to make powerful and confident decisions when buying or selling a home.

  • Mortgage rates remaining near historic lows and houses selling in an average of only 29 days are just two key elements driving the strength of today’s market.

  • With the national data shown here, make sure to also determine what’s happening in your local market so you are fully informed when you’re ready to make your next move.

Home Sales Expected to Continue Increasing in 2020.

Freddie MacFannie Maeand the Mortgage Bankers Association are all projecting home sales will increase nicely in 2020.

Below is a chart depicting the projections of each entity for 2019, as well as for 2020.

Single Family Home Sales.jpg

As we can see, Freddie Mac, Fannie Mae, and the Mortgage Bankers Association all believe homes sales will increase steadily over the next year. If you’re a homeowner who has considered selling your house recently, now may be the best time to put it on the market.

Top 10 Most Expensive Cities in the U.S.

People relocating for business, new jobs or simply planning a vacation can benefit from knowing details about the most expensive cities in the United States. Understanding how much it costs to live in a city, and why, can make or break a decision to move. Not surprisingly, California cities dominate the list of America’s priciest cities.

KEY TAKEAWAYS

  • Cities offer a variety of employment opportunities along with loads of culture, sports, dining, and entertainment.

  • Because of the desire to live in cities, they can become quite expensive places to live.

  • In the U.S., New York City is the most pricey to live in, followed by San Francisco - however, NYC is only #9 on the world's most expensive cities.

  • Fast Fact: The most expensive cities to live in 2019 in the world are Hong Kong, Tokyo, and Singapore. New York City, the only American city to make the top 10, comes in at #9.

1. New York City, New York

New York City leads the pack as the most expensive city in the United States; the city, with a population exceeding 8.3 million, also tops lists of the world’s most expensive cities. The cost of living in New York is a whopping 120% higher than the national average. The average cost of homes in New York is about $501,000, compared to the national average price, which hovers around $181,000; home prices range across the five boroughs, with home prices in Manhattan exceeding $1 million. Everything costs more in New York City, from groceries to public transportation. At approximately 4.1%, as of May 2019, the city’s unemployment rate is lower than the national average of 4.3%, further encouraging people the world over to pin their hopes and dreams on making it in New York.

2. San Francisco, California

People make the decision to leave San Francisco every day, as the city’s staggeringly high cost of living and out-of-reach housing prices have been known to break many a bank. Homes cost an average of $820,000 inside the city, whose major industries include tourism, IT and financial services. It takes more than $119,000 to live well in San Francisco, but unemployment remains extremely low at just 1.9%, as of May 2019, due to highly favorable conditions offered to entrepreneurs and the one-third of all U.S. venture capital that these up-and-coming businesses attract.

3. Honolulu, Hawaii

Honolulu residents pay a lot of money for just about everything. Groceries alone cost 55% more than anywhere else in the United States; utilities cost 71% more than the national average. At $58,397, the average household income does not far exceed the average income of other expensive cities in the country. However, people in Honolulu can expect to pay 87% more than the average American pays for one dozen eggs. Honolulu enjoys an exceptionally low unemployment rate of 2.8%, as of May 2019, which means that, if nothing else, people with jobs on this Pacific island paradise can afford to eat omelets.

4. Boston, Massachusetts

Groceries and health care cost a lot of money in Boston, exceeding the average national cost by more than 20%. The city enjoys a robust higher education environment, a booming tech scene that rivals Silicon Valley and historic sites dating back to the 13 original colonies, which makes it one of the nation’s leading tourist destinations. All of these add up to an unemployment rate of 3.6%, but city residents fork out big money to live in Boston; the average home value hovers around $374,000, the median household income averages about $53,163, and it takes approximately $84,000 to live well.

5. Washington, D.C.

Being the seat of the world’s most powerful nation accounts for Washington, D.C.’s high cost of living. Government and private-sector jobs abound in the city, thanks to numerous federal agencies, think tanks, lobbying firms and a robust tourism sector. Average home values in the District stand at approximately $443,000, and the average household income is about $64,267. Similar to Boston, it takes about $83,000 to live well in Washington, D.C.

6. Oakland, California

Being located on the opposite end of the Bay Bridge might make living in Oakland a cheaper alternative to San Francisco, but the city is still a more expensive place to live than most cities in the United States. For $1,673 per month, renting an apartment in Oakland costs double the price of renting in other U.S. cities; the average home value runs about $449,800.

7. San Jose, California

Anyone looking to escape high prices in the Bay Area can head south to San Jose, located within commuting distance of San Francisco and Oakland. The presence of Silicon Valley makes everything in San Jose expensive, including housing that averages about $575,000. The median household income hovers around $81,000. The numerous tech industry employers in the city account for a well lower-than-average unemployment rate of 2.4%, as of May 2019.

8. San Diego, California

A strong defense department presence and military contracting firms, such as Northrop Grumman Corporation (NYSE: NOC) and Science Applications International Corporation (NYSE: SAIC), make California’s southernmost city one of the priciest in America. The cost of living in this city of approximately 1.3 million is 30% higher than the average cost of living in the United States. San Diego’s median household income hovers around $63,990, meaning that many residents can enjoy luxuries such as high-end eateries, yacht clubs and other pricey forms of entertainment. The average home value stands at approximately $477,800. San Diego’s unemployment rate of 3.8% edges close to the national average.

9. Los Angeles, California

Los Angeles brings to mind wealthy, glamorous movie stars, but the movie industry plays a small role in the city’s booming economy. The city's shipping industry also plays a role, as the Port of Los Angeles is one of the busiest ports in the world. A bustling manufacturing sector and a noteworthy start-up scene contribute to the city’s high cost of living. Certain ZIP codes, such as the much-ballyhooed 90210, drive up housing costs; the average home value in Los Angeles is $470,000. The median household income is around $49,745. It takes approximately $74,371 per year to live well in Los Angeles, and more than 20% of the city’s residents live in poverty.

10. Miami, Florida

Miami is the only southern U.S. city ranking on the top 10 most expensive list. A high population of wealthy foreigners, the presence of numerous international financial institutions and the busiest cruise ship port in the world give life in Miami a high price tag. The city’s average household income stands at about $48,100, and the unemployment rate of about 4.4% is just a hair above the national average. It takes about $77,000 to live well in this stylish city replete with newly constructed residential and commercial buildings.

Top Priorities When Moving with Kids

According to the Pew Research Center, around 37% of U.S students will be going back to school soon and the rest have already started the new academic year. With school-aged children in your home, buying or selling a house can take on a whole different approach when it comes to finding the right size, location, school district, and more.

Recently, the 2019 Moving with Kids Report from the National Association of Realtors®(NAR) studied “the different purchasing habits as well as seller preferences during the home buying and selling process.” This is what they found:

When Purchasing a Home

The major difference between the homebuyers who have children and those who do not is the importance of the neighborhood. In fact, 53% said the quality of the school district is an important factor when purchasing a home, and 50% select neighborhoods by the convenience to the schools.

Buyers with children also purchase larger, detached single-family homes with 4 bedrooms and 2 full bathrooms at approximately 2,110 square feet.

Furthermore, 26% noted how childcare expenses delayed the home-buying process and forced additional compromises: 31% in the size of the home, 24% in the price, and 18% in the distance from work.

When Selling a Home

Of those polled, 23% of buyers with children sold their home “very urgently,” and 46% indicated “somewhat urgently, within a reasonable time frame.” Selling with urgency can pressure sellers to accept offers that are not in their favor. Lawrence Yun, Chief Economist at NAR explains,

“When buying or selling a home, exercising patience is beneficial, but in some cases – such as facing an upcoming school year or the outgrowing of a home – sellers find themselves rushed and forced to accept a less than ideal offer.”

For sellers with children, 21% want a real estate professional to help them sell the home within a specific time frame, 20% at a competitive price, and 19% to market their home to potential buyers.

Bottom Line

Buying or selling a home can be driven by different priorities when you are also raising a family. If you’re a seller with children and looking to relocate, contact a local real estate professional to help you navigate the process in the most reasonable time frame for you and your family. I am happy to help if you are in the Napa Valley or I can refer you to an experienced agent in a different area.

Experts Predict a Strong Housing Market for the Rest of 2019

We’re in the back half of the year, and with a decline in interest rates as well as home price and wage appreciation, many are wondering what the predictions are for the remainder of 2019.

Here’s what some of the experts have to say:

Ralph McLaughlin, Deputy Chief Economist for CoreLogic

“We see the cooldown flattening or even reversing course in the coming months and expect the housing market to continue coming into balance. In the meantime, buyers are likely claiming some ground from what has been seller’s territory over the past few years. If mortgage rates stay low, wages continue to grow, and inventory picks up, we can expect the U.S. housing market to further stabilize throughout the remainder of the year.”

Lawrence Yun, Chief Economist at NAR

“We expect the second half of year will be notably better than the first half in terms of home sales, mainly because of lower mortgage rates.”

Freddie Mac

“The drop in mortgage rates continues to stimulate the real estate market and the economy. Home purchase demand is up five percent from a year ago and has noticeably strengthened since the early summer months…The benefit of lower mortgage rates is not only shoring up home sales, but also providing support to homeowner balance sheets via higher monthly cash flow and steadily rising home equity.”

Bottom Line

The housing market will be strong for the rest of 2019. If you’d like to know more about your specific market, contact a local real estate professional to find out what’s happening in your area.

5 Easy Steps To Avoid Overwhelm From Media Overload

When someone is thinking about buying or selling a home, they want to be well-informed. They want to make the right decision for themselves and their family. They scour the internet for any information they can find about the housing market.

Today, there is an abundance of information available. It is often conflicting news. It can easily lead to confusion and concern, perhaps even causing a potential buyer or seller to cancel their plans to move altogether. Instead, the best things to do are sit down and take a deep breath.

In a recent article, Jeff Davidson, a recognized speaker on the subject of productivity, explained:

“The pace at which new information arrives will accelerate every day…Too often, the reflex to take action only exacerbates your time-pressure problems. Do not bite off more than you can chew, and acknowledge that often, the wisest response to too much competition for your time and attention is to simply slow down to assess the best way to proceed.”

To that point, here is an easy five-step process to follow if all of this information seems overwhelming:

  1. Calm Down – Don’t let the confusion lead to concern or panic.

  2. Slow Down – As Davidson suggests, just “slow down to assess.”

  3. Think – Remember the reasons you wanted to move in the first place. Are they still important?

  4. Plan – Determine whether or not the new information should change anything. If you need further clarification on some points, reach out to a real estate professional in your area for a better understanding.

  5. Act – After thorough consideration, feel good about your decision, whether you decide to move or not.

Bottom Line

Don’t let the plethora of seemingly conflicting information on the housing market stop you from moving forward with your life. Get valuable counsel from an industry professional you trust, and then make the right decision for you and your family.